
Hedera (HBAR) has gained more than 13% in the last 24 hours, reversing most of its weekly losses and turning sentiment slightly positive again. The HBAR price is still down about 18% over the past month, but the current bounce shows much stronger conviction than earlier attempts.
The question now is whether this rebound can mature into a real rally. One level decides everything.
Sponsored
Sponsored
Buyer Strength Builds, but Momentum Still Shows a Small Warning
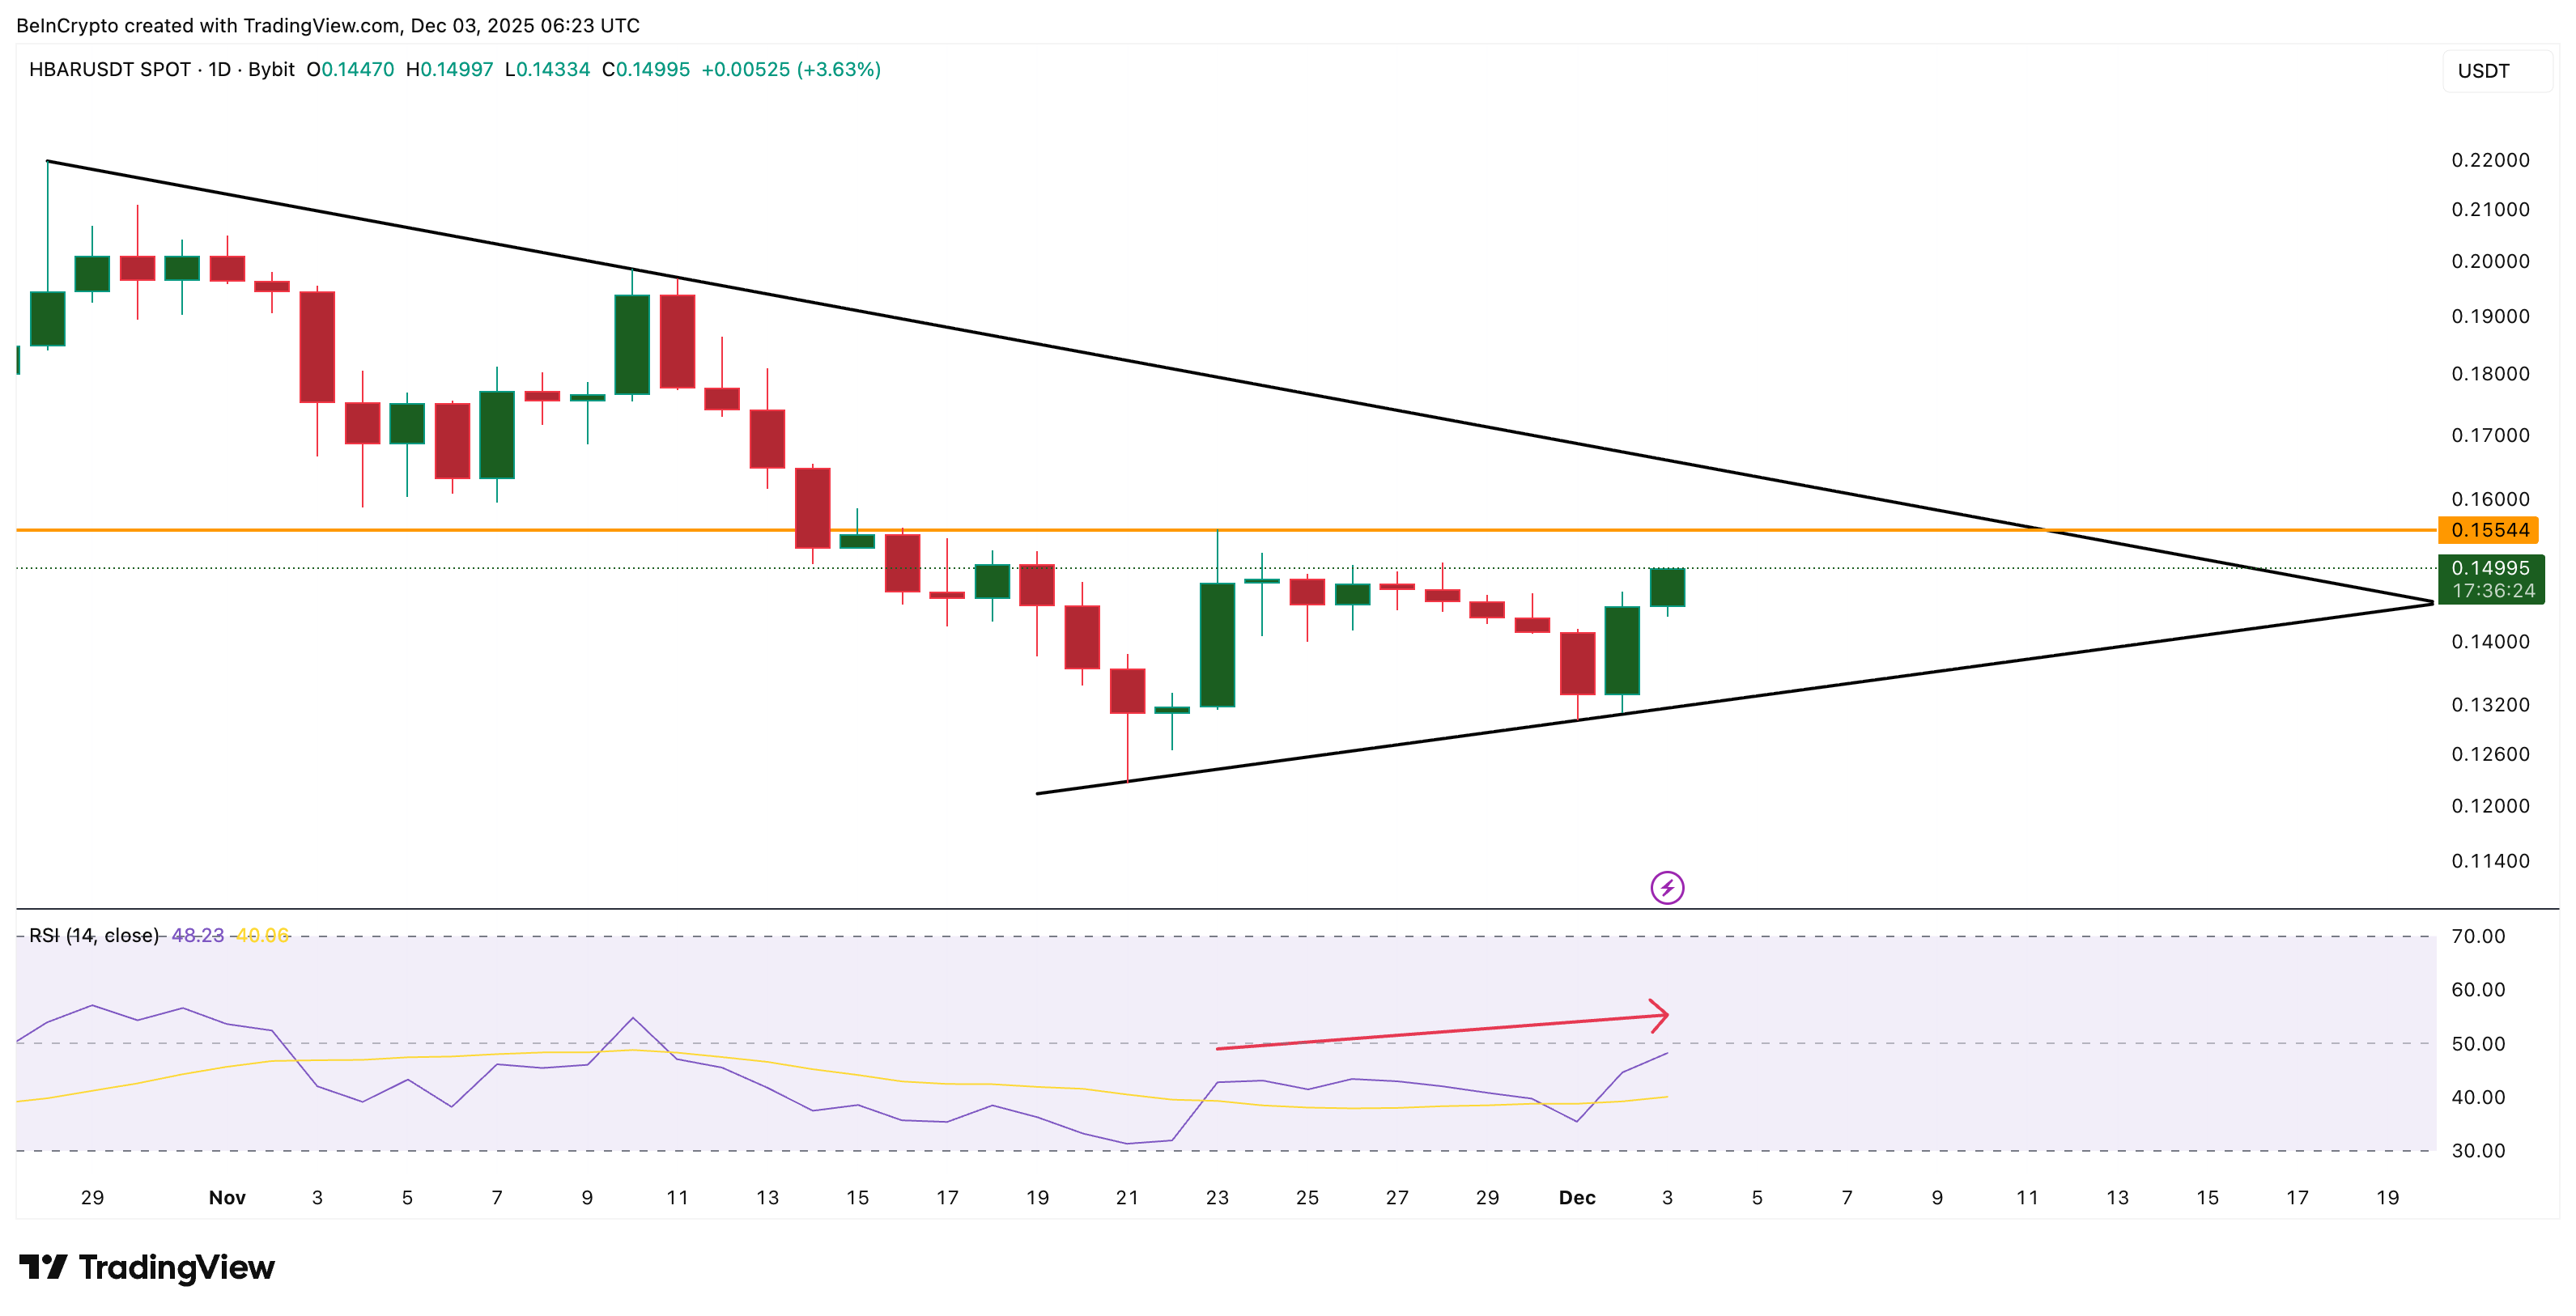
The HBAR price is trading inside a triangle pattern, where buyers and sellers narrow into a tight range. Breakouts from triangles usually decide the next lasting move, and two key indicators explain why this one matters.
The first is CMF, or Chaikin Money Flow, a metric that tracks whether large wallets are increasing or decreasing their exposure. CMF recently broke above its downward trend line (showing strength) and now sits near 0.03. If it climbs toward 0.07, CMF would form a higher high even without the price needing to retest the old swing high near $0.198. That would signal rising spot demand and give the rebound real support.
Want more token insights like this? Sign up for Editor Harsh Notariya’s Daily Crypto Newsletter here.
The second indicator is RSI, the Relative Strength Index, which measures momentum on a 0–100 scale. Between November 23 and December 3, RSI made a higher high while the HBAR price made a lower high. This is a hidden bearish divergence, and it often suggests a mild pullback during broader downtrends.
Sponsored
Sponsored
But the divergence has a clear defeat point: RSI loses its bearish signal if HBAR closes above $0.155. That level removes the mismatch between price and momentum and confirms buyers are strong enough to push past the ceiling of the triangle.
Together, CMF strength and the RSI warning explain why HBAR is pressing inside the pattern but still hasn’t fully broken out. The big-money support keeps the structure stable, but the hidden bearish divergence shows buyers still lack the momentum needed to push past the upper trend line, which is why the triangle pattern continues to hold.
HBAR Price Levels: The One Break That Turns the Rebound Into a Rally
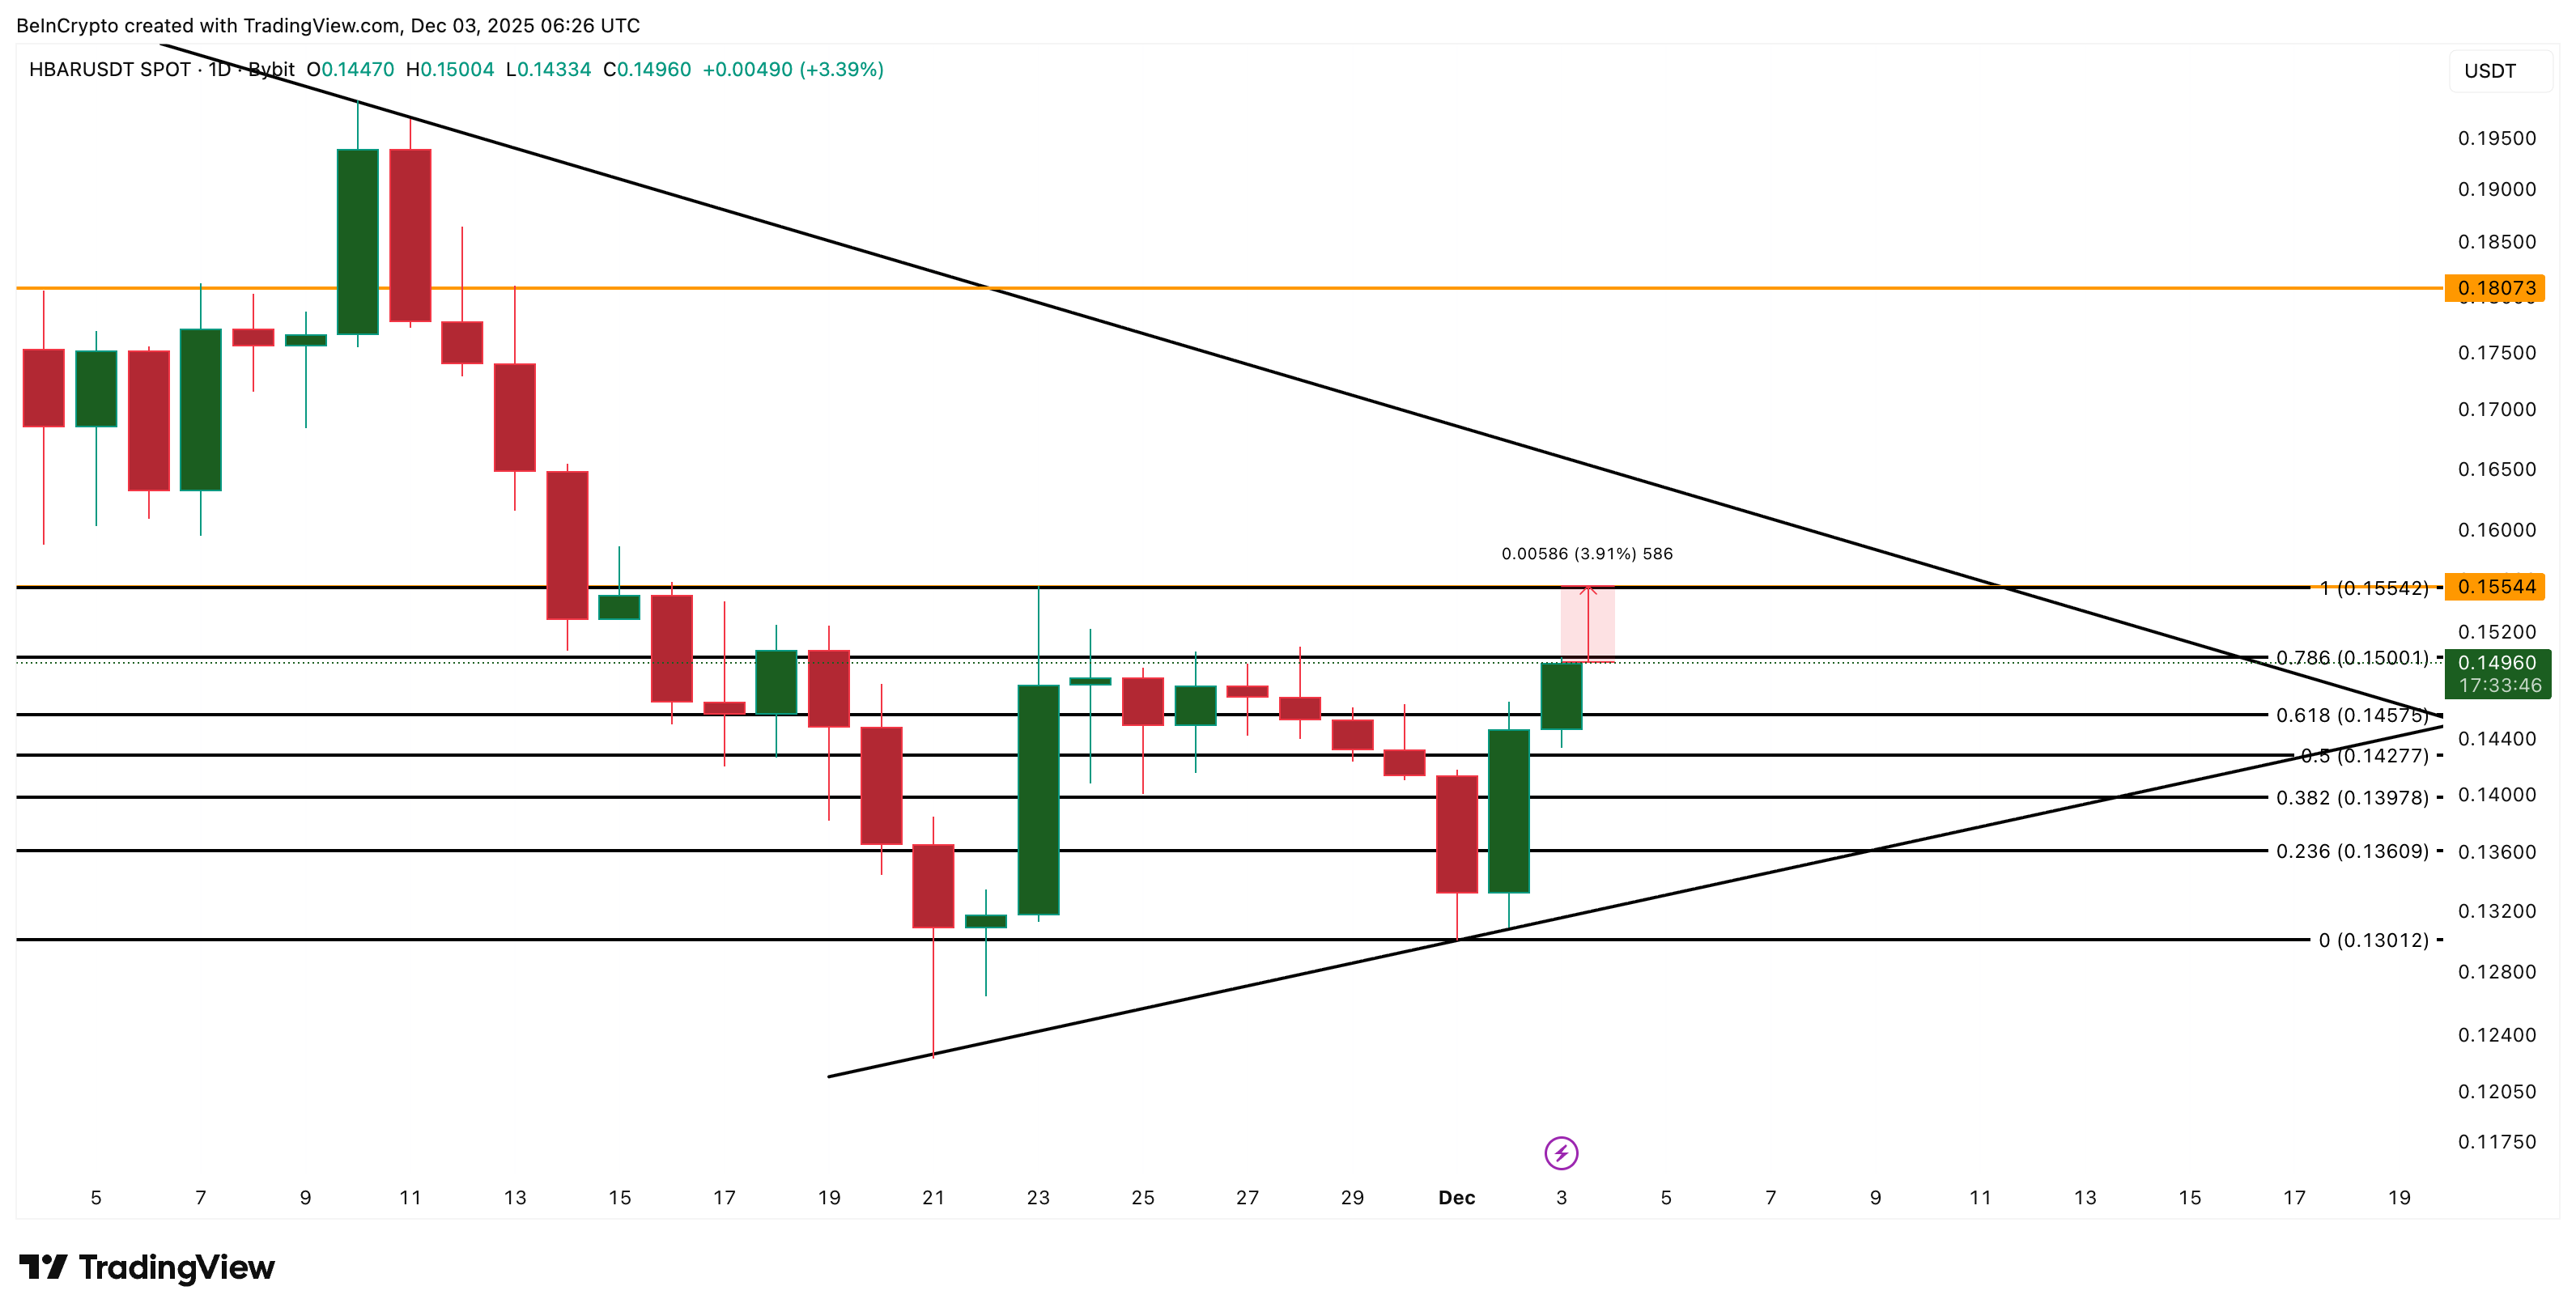
HBAR trades around $0.149, but the entire setup revolves around a single barrier at $0.155. A daily close above $0.155 gets the HBAR price close to the top of the triangle. It also defeats the RSI divergence and confirms that buyer demand is strong enough to shift the trend upward. If that break happens, the chart opens space for a move toward $0.180, if supported by improving CMF.
If the HBAR price stalls, the nearest key support sits around $0.142. This level has acted strong during the recent sessions. A drop below that level weakens the rebound and puts $0.130 back on the table if the broader market softens.
For now, HBAR holds a rare mix. Big money flow strengthening, momentum mixed but fixable, and one hurdle ($0.155) that decides whether this rebound becomes a full rally or slows again.