
Everyone in crypto gets excited for an “altseason,” but what does that really mean? It’s that stretch of time when coins other than Bitcoin start putting up bigger gains, showing a major shift in where traders are putting their money. It’s not a real altseason just because a few coins are pumping; you need to see broad market strength and check the data to confirm it’s the real deal.
What is an altseason? It’s all about capital rotation
An altseason isn’t some officially declared event; it’s a phase you identify by watching the market.
Think of it as a massive rotation of money. Investors who scored big on a Bitcoin rally start looking for their next move, shifting profits into the riskier, but potentially more rewarding world of altcoins. This fire gets fanned by hot new trends, like the latest DeFi or NFT craze, that grab everyone’s attention and fuel a ton of speculation.
The main tools for confirmation
To know for sure, traders use a few key indicators instead of just guessing.
The Altcoin Season Index – A clear scorecard
Your most direct tool is the Altcoin Season Index. This metric looks at how the top 50 or 100 altcoins have performed against Bitcoin over the last 90 days. The rule is pretty straightforward – If 75% or more of these top alts have done better than Bitcoin, it’s officially an altseason. If 75% are doing worse, it’s a “Bitcoin Season.”
As of mid-July 2025, the numbers showed that things have been heating up, but it’s not a full-blown party yet. What this means is that Bitcoin is still running the show, though the first signs of a change are there.

Source: BlockchainCenter
Bitcoin Dominance (BTC.D) – The old-school tell
A classic indicator that often gives an early warning is Bitcoin Dominance (BTC.D). This simply measures Bitcoin’s slice of the total crypto market pie. When BTC.D starts falling for a sustained period, it’s a huge tell that money is flowing out of Bitcoin and into alts faster than ever.
Historically, the biggest altseasons fired up right after a sharp fall in Bitcoin’s dominance. Traders get serious when BTC.D breaks below key support levels, like 62% or 54%. With dominance currently sitting around 60% in July 2025, the market is watching intently for a drop that could light the fuse for a massive altcoin rally.
Given that figures for the same have fallen by almost 5% in the last 3 weeks alone, there is good reason for optimism.
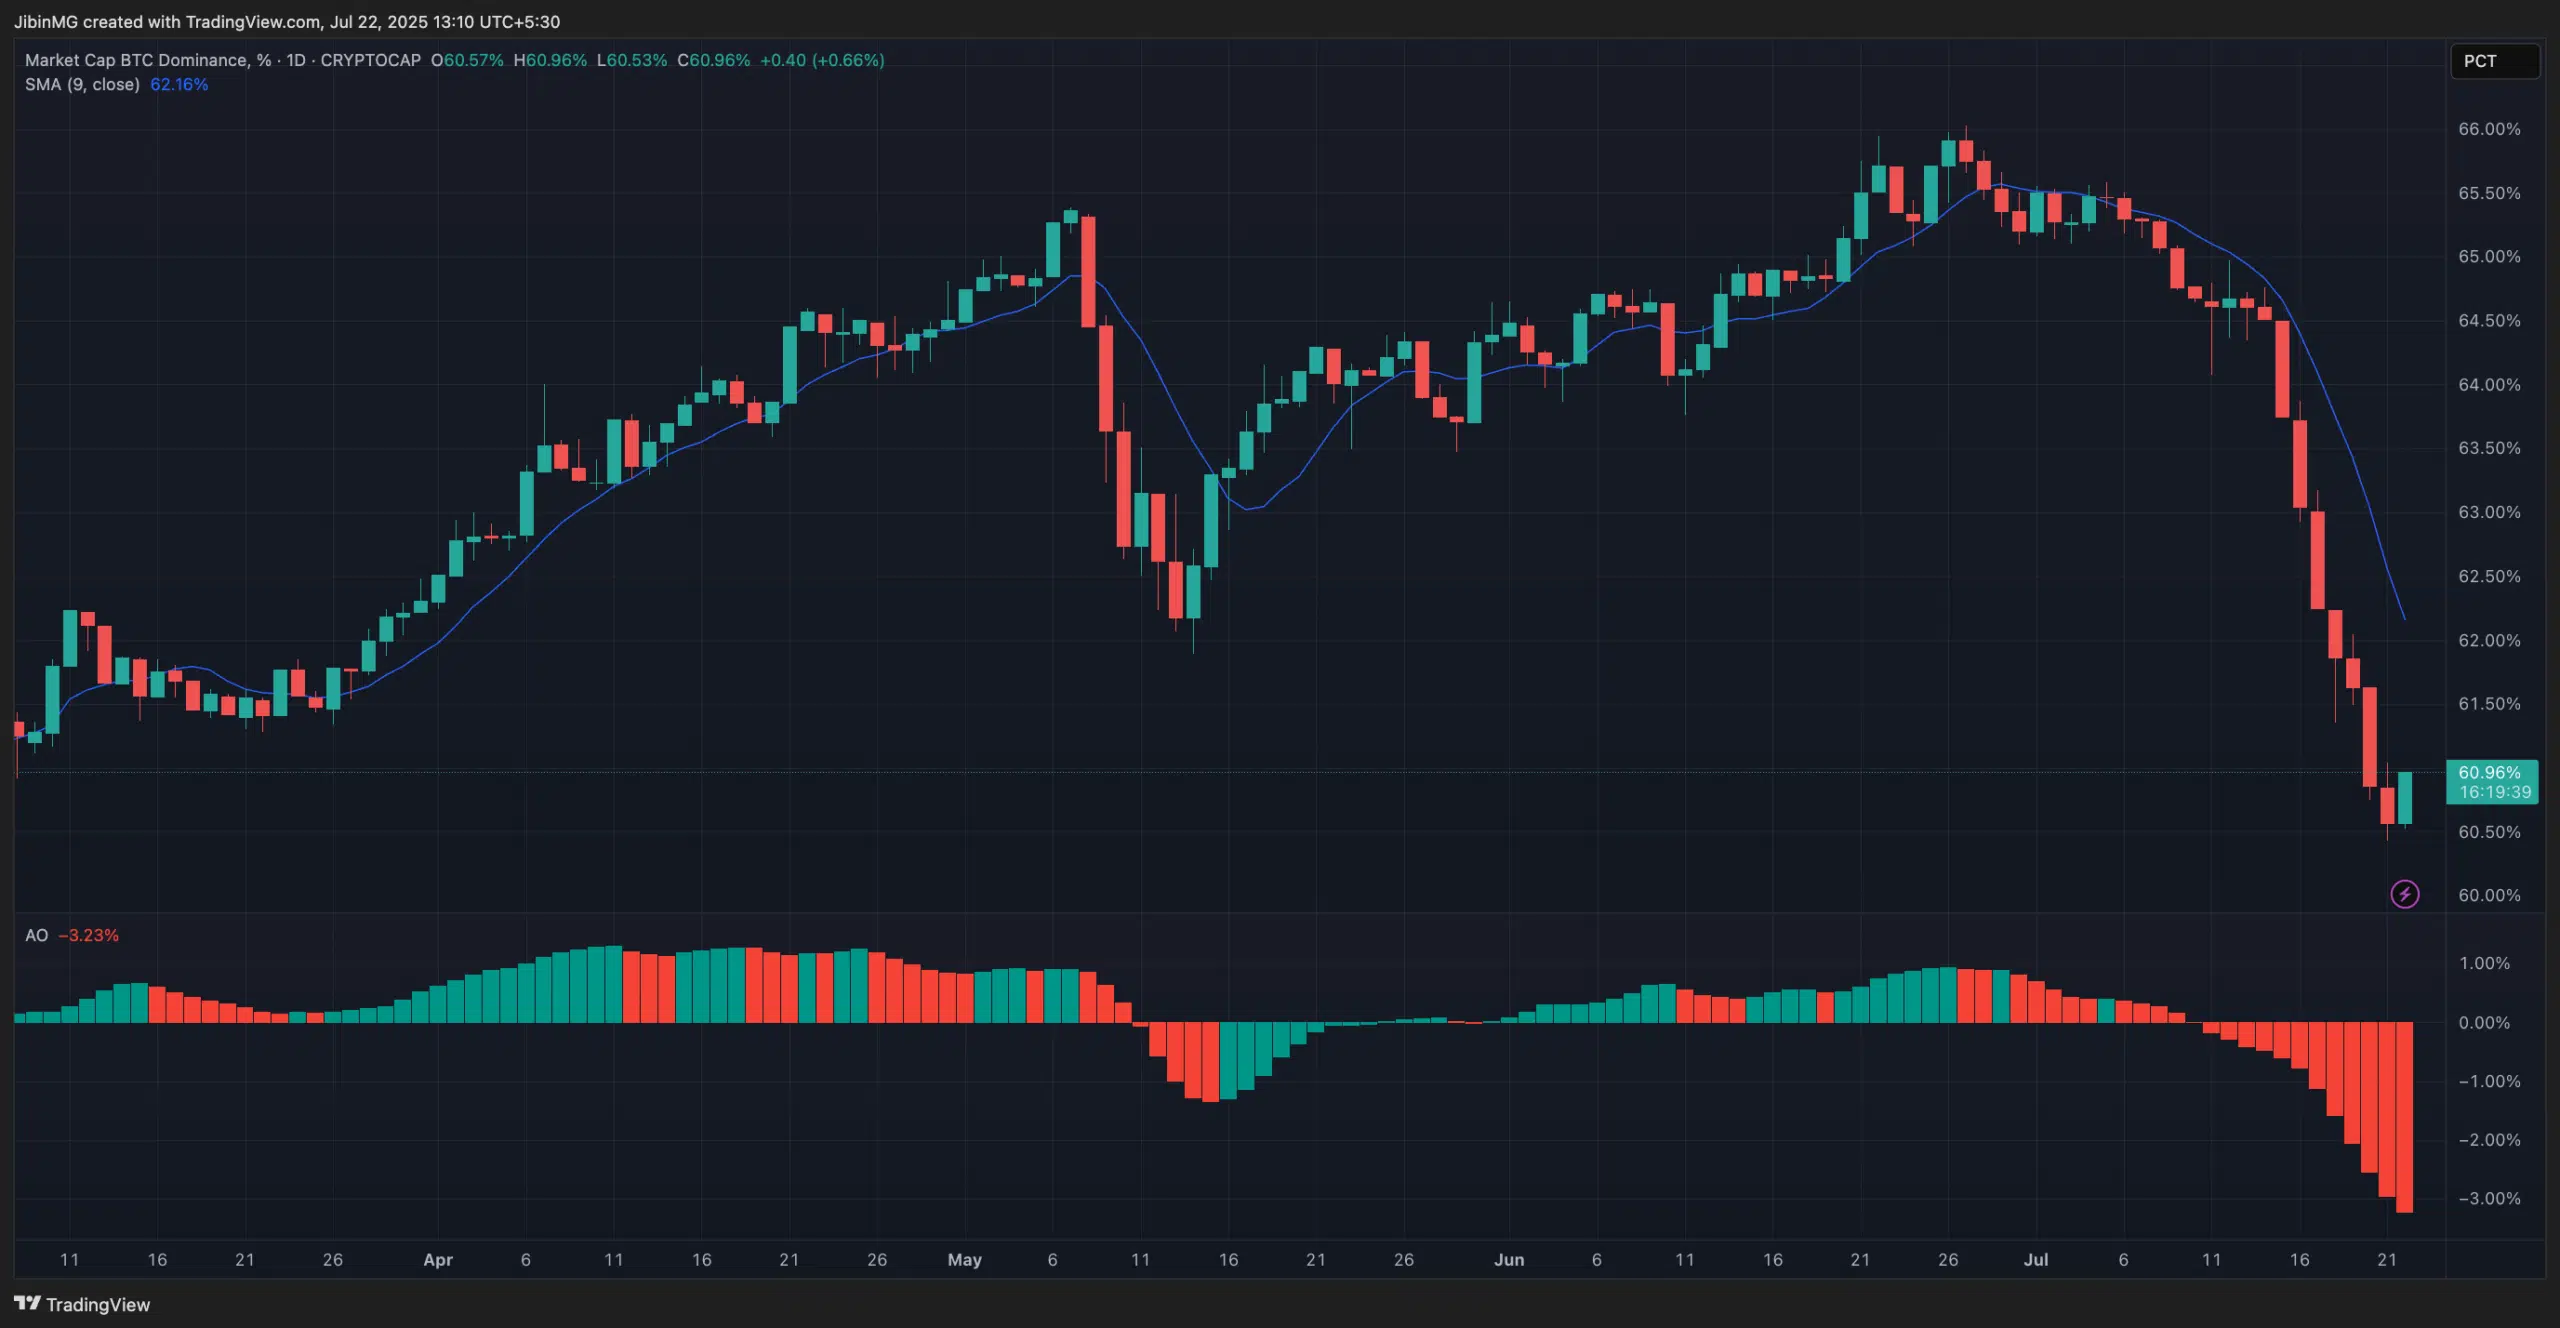
Source: TradingView
Following the money with market cap charts
Beyond the main indexes, you need to look at specific charts to really understand where the money is going.
- TOTAL2 (The Altcoin Market Cap) – This chart is crucial. It shows the total market value of all cryptocurrencies without Bitcoin. When you see a strong, steady uptrend here, it’s clear proof that the altcoin market is gaining serious momentum. If the recent move past $1.5 trillion holds, analysts say it could mark the strongest monthly close ever.
- TOTAL3 (Altcoins without BTC & ETH) – If you want to see the market’s true risk appetite, check out TOTAL3. This chart strips away both Bitcoin and Ethereum to give you a raw look at the more speculative, smaller-cap alts. A powerful surge in TOTAL3 is a tell-tale sign of a classic altseason, showing that traders are willing to bet big on riskier assets. The next major test is for this chart to blast through the $1.16 trillion resistance level.
Other important clues
The ETH/BTC Ratio – The leader of the pack
The price of Ethereum versus Bitcoin (ETH/BTC) is a powerful signal on its own. As the biggest altcoin, Ethereum often makes the first move. A rising ETH/BTC ratio means ETH is outperforming Bitcoin, which has historically been the first domino to fall before money cascades down into the wider altcoin market.
On-Chain data and social buzz
A complete picture includes watching the activity on the blockchain and the chatter online –
- Trading Volume – A simple but effective sign. When you see trading volumes for many different altcoins spike, you know interest and cash are pouring in.
- Stablecoin Inflows – Watch for a big increase in stablecoins like USDT and USDC moving to exchanges. This is like “dry powder” being prepared on the sidelines, ready for a buying spree.
- Social Media Hype – While it’s not a hard metric, you can’t ignore the buzz. A tidal wave of positive talk, FOMO, and trending altcoin hashtags on platforms like Twitter and Reddit often comes right before a major retail-driven rally. The Crypto Fear & Greed Index is another tool for this, measuring market mood; extreme greed can be a sign that a top is near.
How institutions are changing the game
The crypto market isn’t the same as it was a few years ago. Institutional investors, mostly buying Bitcoin through ETFs, have locked up a huge amount of capital in BTC. This has led some to think that future altseasons won’t be an “everything pumps” event, but will instead favor high-quality projects. At the same time, other reports show that 73% of these institutions already own altcoins besides Bitcoin and Ethereum, showing they’re hungry for more than just the top dogs.
Ultimately, calling an altseason requires connecting all these dots. The Altcoin Season Index provides a score, but the real story is told by watching Bitcoin’s dominance fall, money flow into the TOTAL2 and TOTAL3 charts, and Ethereum lead the charge against Bitcoin. By putting these pieces together, you can tell the difference between a few isolated pumps and a genuine, market-wide shift in power.