
Key Takeaways
The short-term price action of Ethereum reflected a cautious market that leaned bearishly, despite the $287 million in inflows on the 21st of August. The liquidation heatmap showed that more volatility may be in store for ETH.
Ethereum [ETH] saw a 3% price drop on the 21st of August. It opened the day’s trading at $4,336 and ended at $4,225. On the same day, Bitcoin [BTC] also shed 1.55% in value.

Source: Farside Investors
Data from Farside Investors showed that the Ethereum spot ETF flows were primarily negative last month. From the 15th to the 20th of August, the outflows totaled $925.7 million, a severe bout of selling.
This followed a strongly bullish August showing up to that point, with the 11th of August seeing $1.018 billion inflows.
Spot ETF inflows aren’t the only factors that determine whether an asset goes up or down.
A steady stream of inflows reflects buying and demand, but other factors like whale activity, market sentiment, and liquidity can drive daily price movements.
Examining the ETH price action- what drove the recent drop?

Source: ETH/USDT on TradingView
The 4-hour chart has maintained a bearish structure over the past week, with no confirmed bullish reversal yet.
The local high at $4,388 (marked in dotted orange) remains unbroken, signaling continued resistance.
On-balance volume (OBV) has also failed to establish a new high, reflecting weak buying pressure. Meanwhile, the MACD formed a bullish crossover below the zero line, indicating that bearish momentum is fading.
Overall, the indicators and price action suggest a cautious market sentiment that still leans bearish.
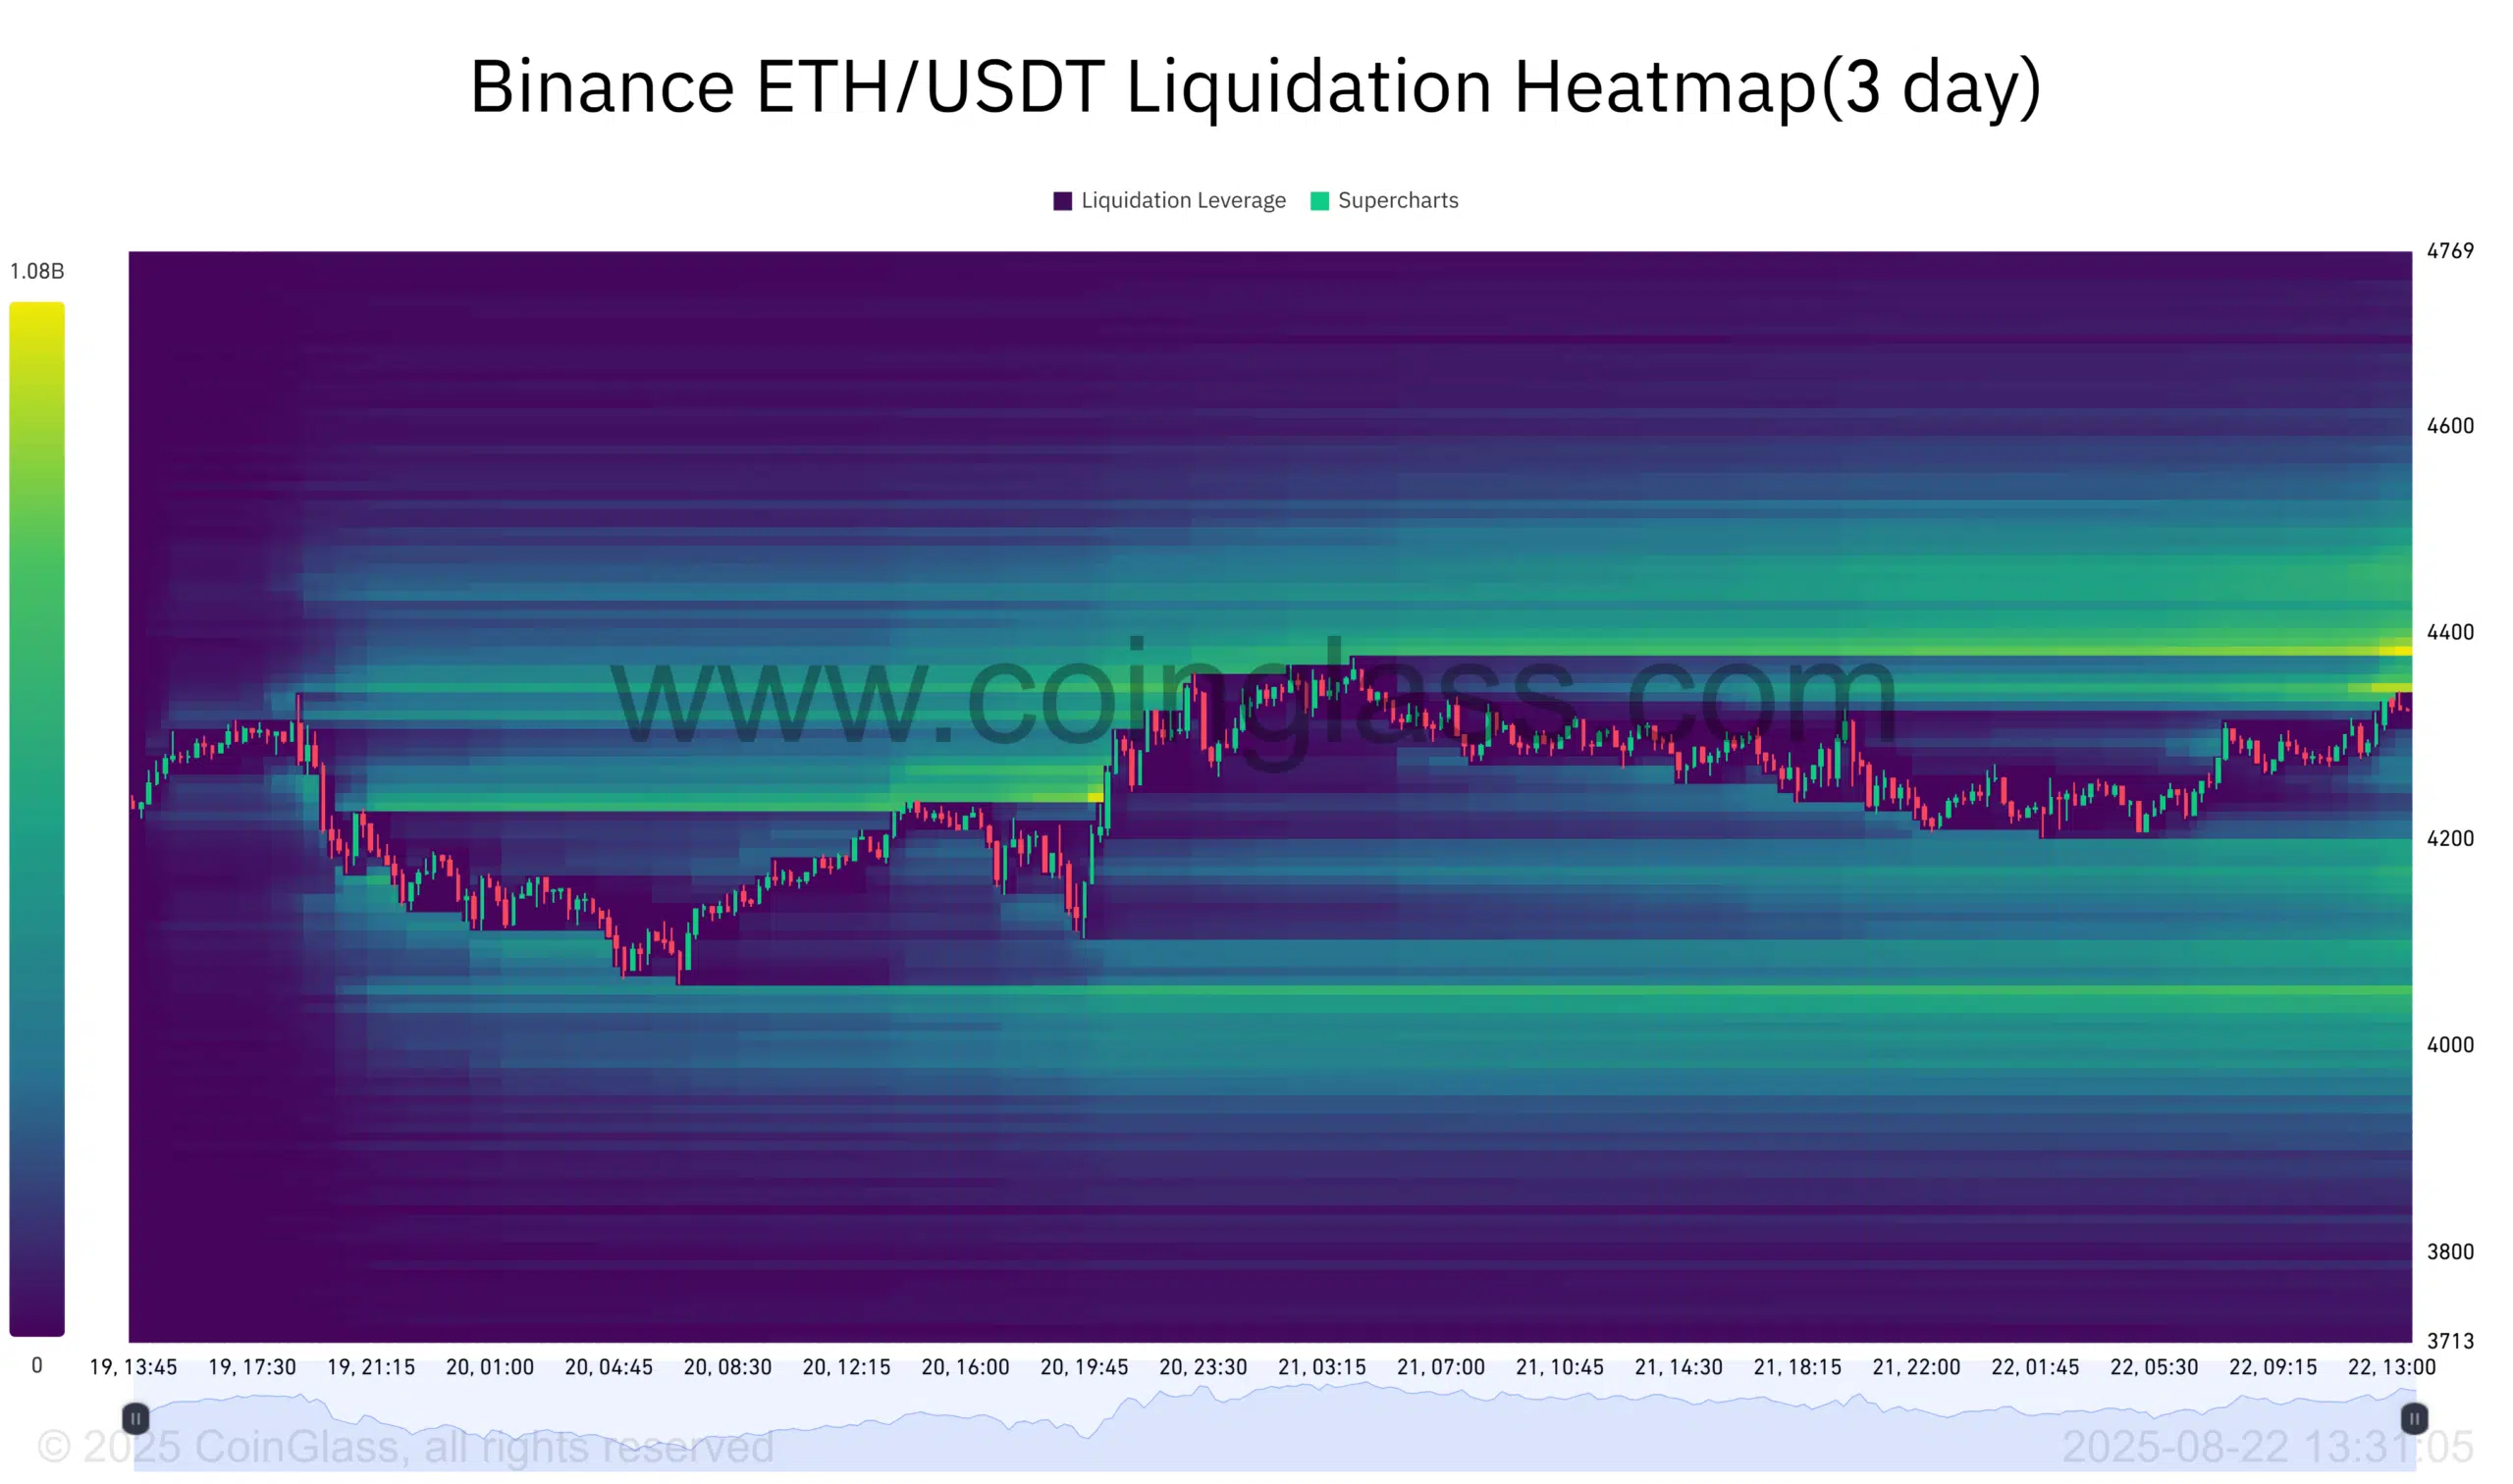
Source: CoinGlass
The prediction that Ethereum would pull back to $4,150 remained valid. The liquidation heatmap of the past three days showed that there were two magnetic zones of interest. The closer, stronger one was at $4,385-$4,410.
The other was at $4,160-$4,200. It was likely that ETH would bounce higher in the coming hours before descending. Short-term price moves tend to be driven more by liquidity and less by spot ETF flows, explaining the initial discrepancy.
The drop on the 21st of August came after the overhead liquidity was tested, and a price drop toward the build-up of liquidity at $4.2k followed.
Disclaimer: The information presented does not constitute financial, investment, trading, or other types of advice and is solely the writer’s opinion