
Hyperliquid (HYPE) shows early signs of a trend reversal after a sharp 12.63% drop in just two days, despite recently setting new all-time highs. Key indicators such as the DMI and RSI point to weakening momentum and growing bearish pressure.
The ADX is rising while -DI overtakes +DI, and RSI has slipped below 40—both suggesting sellers are gaining control. While the EMA structure remains technically bullish, a looming death cross could start a deeper correction if support levels fail to hold.
Hyperliquid Bears Gain Ground as DMI Shifts Bearish
Hyperliquid’s Directional Movement Index (DMI) shows that its Average Directional Index (ADX) has risen to 21.41, up from 17.93 just a day earlier.
This increase suggests that a trend is starting to strengthen, although the current value still reflects a relatively weak trend overall.
The ADX measures the strength—but not the direction—of a trend, with values above 25 typically signaling strong trends and values below 20 indicating low momentum or consolidation.
The supporting directional indicators, however, paint a bearish picture for HYPE. The +DI has fallen sharply to 14.54 from 31.61 just two days ago, while the -DI has climbed to 28 from 12.97 in the same period.
This crossover and widening gap indicate that selling pressure is rising while buying momentum is fading.
If this setup continues, it could point to a developing downtrend for HYPE, with sellers increasingly in control of price action.
Hyperliquid RSI Drops Below 40 as Momentum Weakens
Hyperliquid’s Relative Strength Index (RSI) has dropped to 39.52, down significantly from 56.26 two days ago.
This decline reflects a shift in momentum, with recent selling pressure overtaking buying interest.
As the RSI moves closer to the oversold threshold, it suggests weakening bullish sentiment and a potential transition into bearish territory.
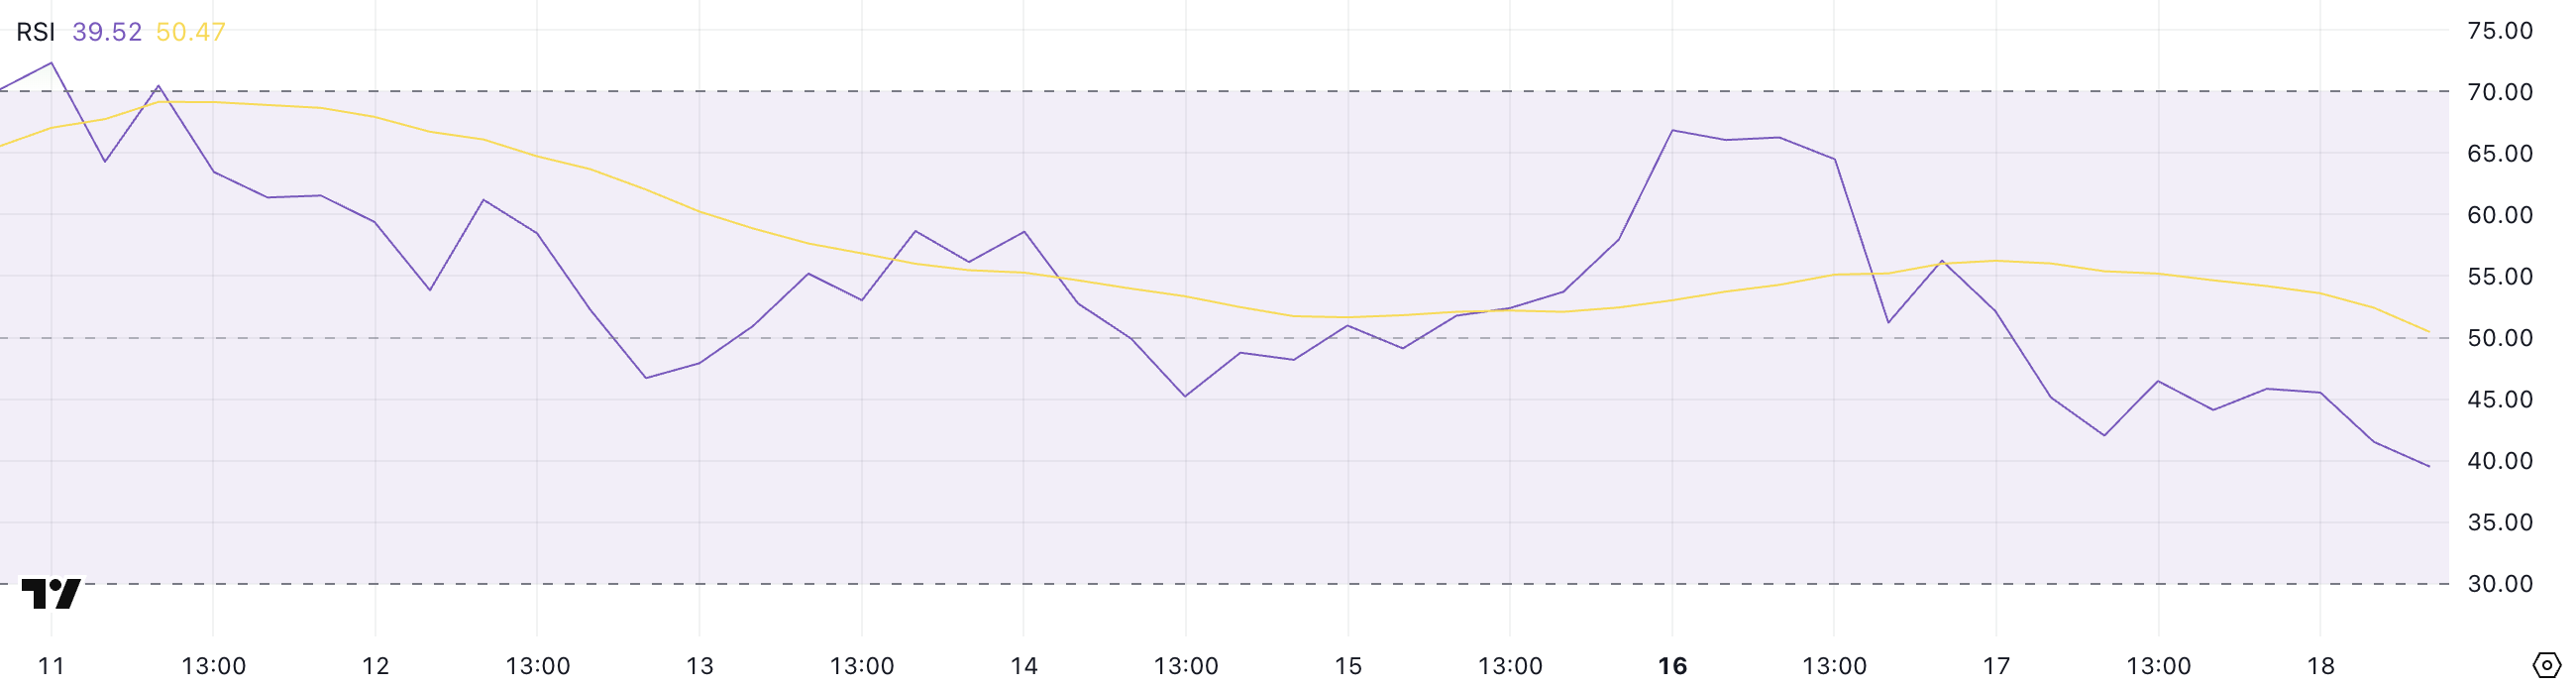
The RSI is a momentum indicator that measures the speed and magnitude of recent price changes. It ranges from 0 to 100.
Readings above 70 typically signal overbought conditions—often followed by price corrections—while readings below 30 suggest oversold conditions and potential for a rebound.
An RSI of 39.52 places Hyperliquid in a neutral-to-weak zone, indicating declining momentum but not yet reaching levels that typically prompt a reversal. If RSI continues to fall, it could point to further downside risk unless momentum shifts occur.
HYPE Pulls Back After ATH as Key Support Levels Come Into View
Hyperliquid recently reached new all-time highs but has since pulled back sharply, falling 12.63% over the last two days. This decline comes despite its EMA lines still holding a bullish structure.
However, a potential death cross could be forming where short-term EMAs cross below long-term ones.
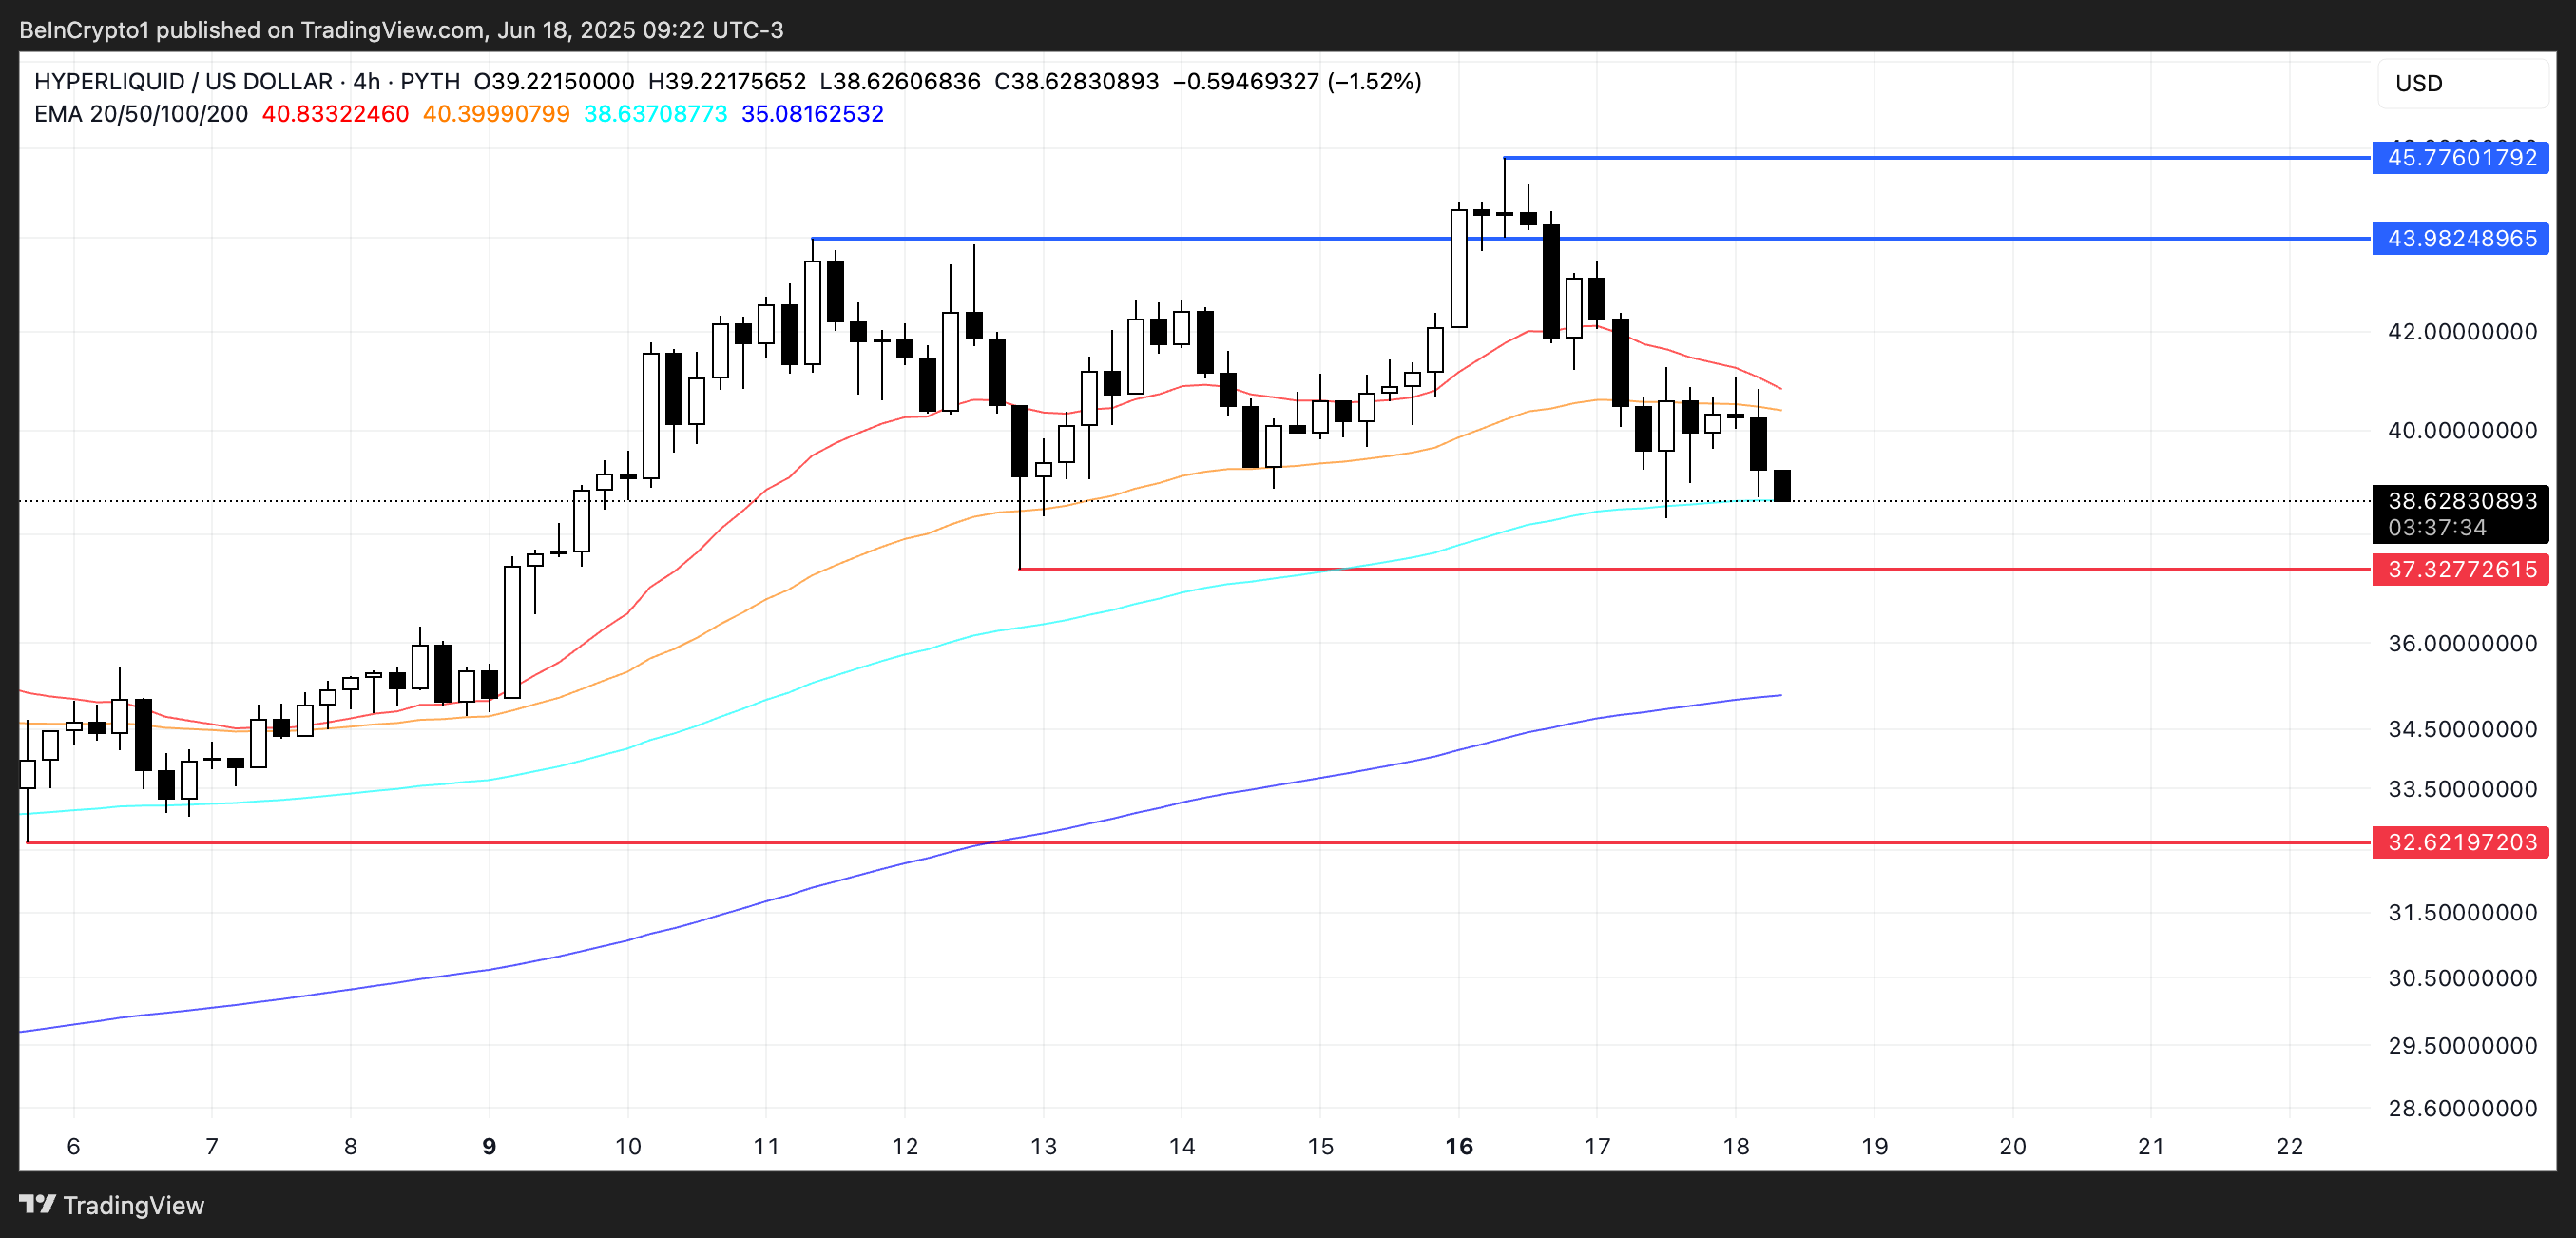
If this bearish crossover confirms, HYPE may test the key support at $37.32, and a break below that level could expose it to further downside toward $32.62.
Conversely, if momentum shifts and the bullish structure holds, Hyperliquid could recover and retest the resistance zones at $43.98 and $45.77.
A strong move above those levels would likely signal a renewed uptrend and open the path for a push toward $50, setting new all-time highs once again.
The post Hyperliquid Price Sharply Pulls Back After All-Time High: Is the HYPE Over? appeared first on BeInCrypto.