
Bitcoin is under severe pressure as the market slips into what many analysts now describe as a dangerous zone. The loss of the $90,000 support level — a key psychological and structural threshold — has intensified fear across the crypto landscape. Bulls, who previously defended this region throughout the year, are now losing control as price volatility accelerates and liquidity thins out.
As a result, a growing number of market commentators are beginning to call for the start of a potential bear market, arguing that the trend has shifted decisively.
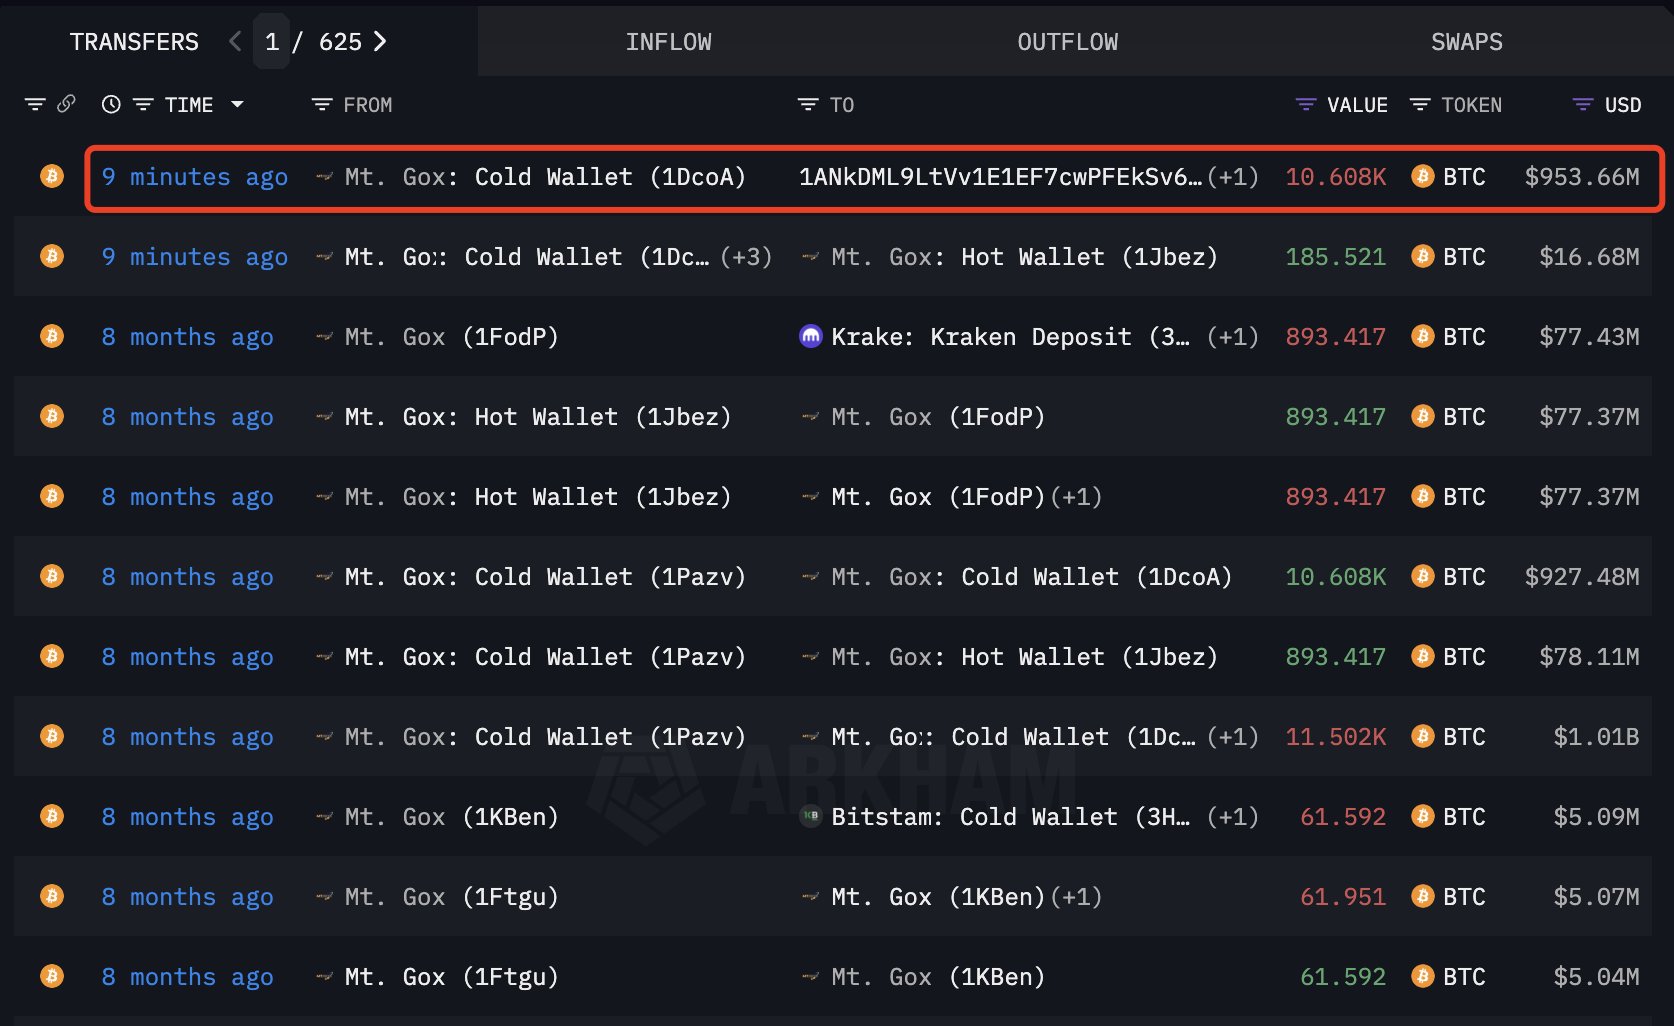
Adding to the panic, new on-chain data shows an unexpected development that has further rattled investors: after eight months of inactivity, Mt. Gox has just transferred 10,423 BTC (worth roughly $936 million) to a new wallet. These movements typically precede distributions to creditors, and historically, any transfer from Mt. Gox has triggered sell-off concerns due to the amount of supply that could enter the market.
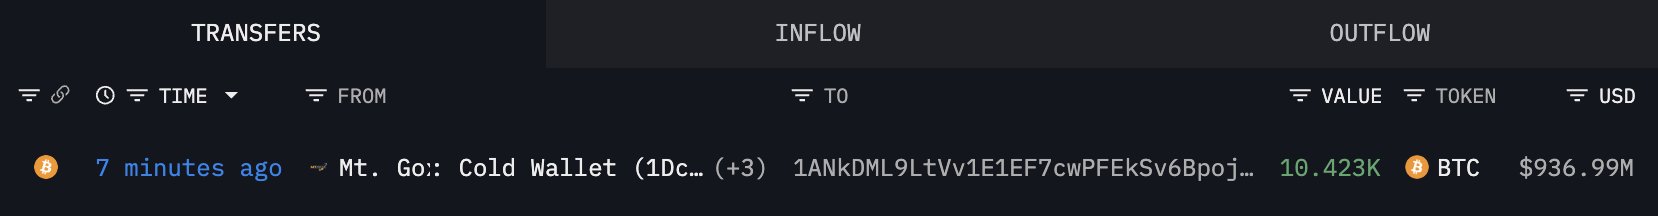
The timing couldn’t be worse. With sentiment already fragile and Bitcoin struggling to find support, the sudden appearance of nearly a billion dollars’ worth of BTC on the move has amplified uncertainty. Whether this sparks a deeper breakdown or becomes another shakeout before recovery remains the question driving today’s market narrative.
What the Mt. Gox Transfer Signals — And Why Markets Are on Edge
Historically, any on-chain movement from Mt. Gox wallets has been interpreted as a precursor to creditor distributions. Even if the coins are not immediately destined for exchanges, the possibility of that supply eventually hitting the market is enough to amplify fear — especially when Bitcoin has just lost the crucial $90K level.
Traders worry that a portion of these funds could be sold, adding tens or hundreds of millions in sell pressure at a moment when liquidity is already thin.
This stress is intensifying because the market is not only dealing with internal crypto dynamics but also major macroeconomic fractures. Japan’s economy is emerging as a pressure point, with the Yen carry trade beginning to unwind again. For years, investors borrowed cheap yen to buy higher-yielding assets, including US Treasuries and even crypto. Now, with Japan under strain and the yen strengthening, those leveraged positions are being forced to deleverage. That unwinding drains liquidity from global markets and puts indirect pressure on risk assets like Bitcoin.
Combined — Mt. Gox supply risk, lost support levels, and macro contagion — the environment is primed for elevated volatility. Whether this becomes a deeper breakdown or a capitulation bottom depends on how the market absorbs the coming days.
Weekly Chart Signals Deep Stress but Key Support Still Holding
Bitcoin’s weekly chart shows a decisive shift in market structure as BTC trades around $90,877, marking one of its sharpest multi-week declines since mid-2024. The breakdown from the $100K–$105K consolidation range pushed price directly into the weekly 50-period moving average, a level that previously acted as dynamic support during multiple pullbacks throughout the cycle.

Losing this level decisively would increase the probability of a deeper retracement toward the $85K–$88K liquidity zone, where the 100-week MA currently aligns.
Volume confirms the severity of the move: red candles have expanded significantly over the past two weeks, suggesting that sellers are in control and that forced liquidations may be accelerating the drop. However, the wick rejections near $89K indicate that buyers are still active at lower levels, absorbing a portion of the sell pressure and preventing a complete breakdown so far.
Structurally, BTC remains above its long-term 200-week moving average, but the distance is narrowing quickly. Historically, when Bitcoin enters this phase — sharp corrections into major weekly supports — it often transitions into a high-volatility environment before choosing a direction.
If bulls can defend the current region and reclaim the $95K–$98K band, momentum could stabilize. If not, the market risks revisiting deeper demand zones.
Featured image from ChatGPT, chart from TradingView.com

Editorial Process for bitcoinist is centered on delivering thoroughly researched, accurate, and unbiased content. We uphold strict sourcing standards, and each page undergoes diligent review by our team of top technology experts and seasoned editors. This process ensures the integrity, relevance, and value of our content for our readers.