The PEPE price broke out from a long-term descending resistance trendline and a short-term ascending parallel channel.
The PEPE team just announced a significant token burn. Will this help the ongoing increase?
PEPE Clears Long-Term Resistance
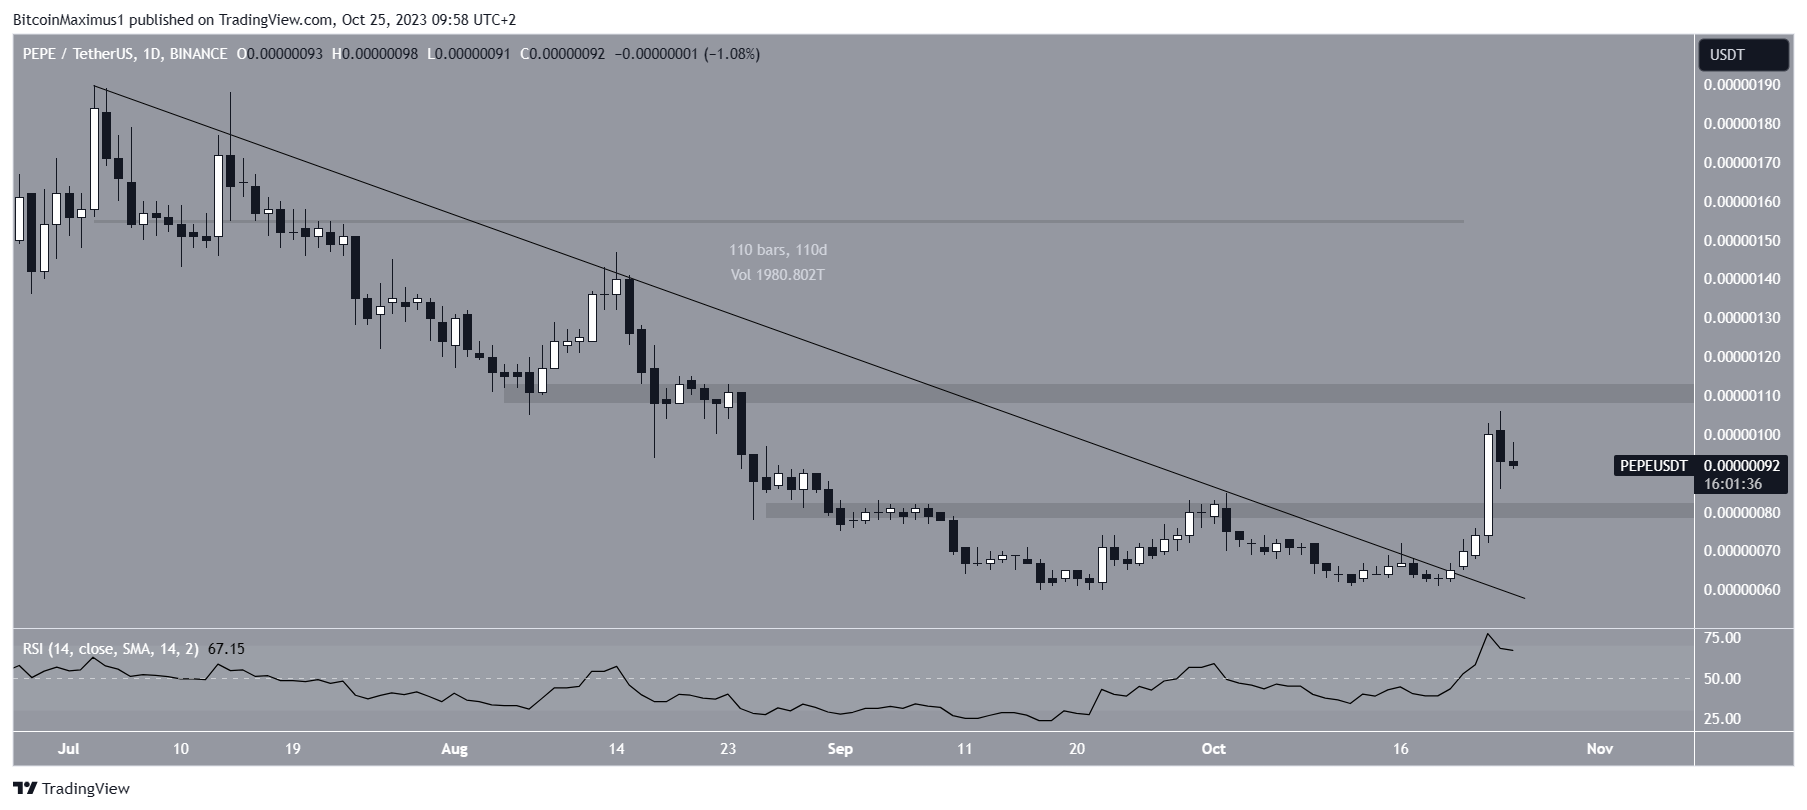
The PEPE price had fallen under a descending resistance trendline since July. The decrease led to a low of $0.00000060 on September 22.
After an upward movement, the PEPE price broke out from the trendline on October 20.
At the time of the breakout, the trendline had been in place for 110 days.
Read More: Top 11 Crypto Communities To Join in 2023
On October 24, PEPE reached a high of $0.00000106, the highest price since August. The increase also took PEPE above the $0.00000080 horizontal resistance area.
The daily Relative Strength Index (RSI) is bullish.
Market traders use the RSI as a momentum indicator to identify overbought or oversold conditions and to decide whether to accumulate or sell an asset.
Readings above 50 and an upward trend indicate that bulls still have an advantage, whereas readings below 50 suggest the opposite.
The RSI is increasing and is above 50, both considered signs of a bullish trend.
Read More: 9 Best Crypto Demo Accounts For Trading
PEPE Hires New Advisors – Burns Tokens
A fresh advisory team is now guiding PEPE. Additionally, the team announced on October 24 that it had burned 6.9 trillion PEPE tokens worth nearly $6.4 million.
The team is currently exploring how to use the remaining 3.79 trillion tokens from the original team’s CEX multi-sig wallet for strategic partnerships and marketing.
The news comes on the heels of a resurgence for the Memecoin market, also evident in another popular memecoin, Dogelon Mars (ELON), which is up 57% in the last week.
PEPE Price Prediction: Where to Next?
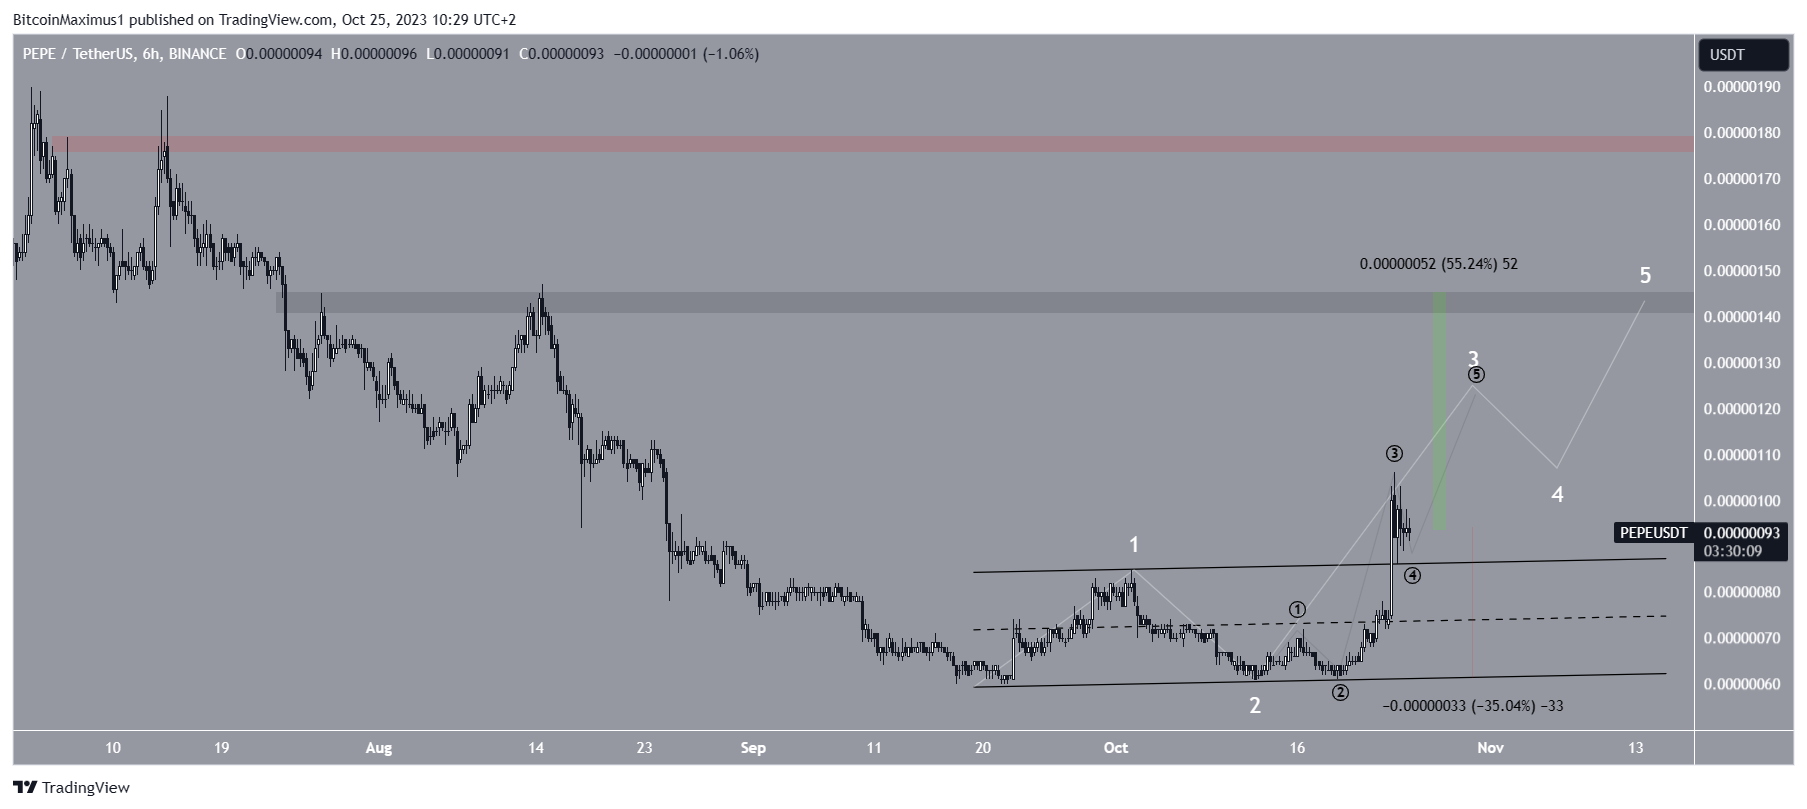
The shorter-term six-hour timeframe also gives a bullish PEPE forecast. The first reason is that the price has broken out from an ascending parallel channel and validated it as support (green icon).
Such breakouts indicate that the upward movement is legitimate and often precedes significant increases.
Well-known cryptocurrency trader Crypto Tony also outlined a similar breakout, albeit drawing the channel’s lines as horizontal.
The second reason comes from the Elliott Wave theory. Technical analysts employ the Elliott Wave theory to identify recurring long-term price patterns and investor psychology, which helps them determine the direction of a trend.
The most likely wave count states that PEPE is in an extended wave three of a five-wave upward movement (white). The sub-wave count is given in black.
If the count is correct, the PEPE price will increase to the next resistance at $0.00000145. This will be an upward movement of 55%, measuring from the current price.
An even higher target of $0.00000175 is given by George1Trader, who uses the range high of July as resistance (red).

Despite this bullish PEPE price prediction, a close below the channel’s resistance line will invalidate the breakout. In that case, a 35% drop to the support line at $0.00000060 will be likely.
Read More: Top 9 Telegram Channels for Crypto Signals in 2023
For BeInCrypto‘s latest crypto market analysis, click here.
The post PEPE Price Reclaims 2-Month High – Are Meme Coins Back? appeared first on BeInCrypto.
