
Pi Network (PI) has been down more than 8.5% in the last seven days. It has traded below $0.65 for six straight days but crashed below $0.60 today. The trend remains weak, with price action stuck below the Ichimoku Cloud.
The altcoin’s RSI briefly went above 50 but has dropped back to 45, showing fading bullish momentum. EMAs are still bearish. It’s hovering just above key support, and the next move may decide between a deeper drop and a potential rebound.
Pi Network Faces Bearish Pressure Below the Ichimoku Cloud
Pi Network is still trading below the Ichimoku Cloud, signaling a bearish market structure overall. However, a potential shift may be developing, as the blue Tenkan-sen (conversion line) has recently crossed above the red Kijun-sen (base line).
This crossover is often seen as an early bullish signal, especially if confirmed by rising volume or a move into the cloud.
Despite this, the future cloud remains red, indicating continued resistance ahead and signaling that the broader trend is still under pressure.
The Chikou Span (lagging line) is still below both the price candles and the cloud. This means any upside move has not yet been confirmed.
For a real trend reversal, PI must break into and above the cloud. The future cloud must also turn green, with all Ichimoku signals aligning bullishly.
Right now, the setup shows indecision. There’s a short-term bullish crossover, but the price is still under the cloud, and the broader trend remains bearish.
Pi Network Momentum Slows as RSI Dips Below 50
Pi Network’s RSI currently sits at 45.41, easing off after a sharp rally from 28.49 to 54.40 just two days ago. This indicates a slowdown in momentum following a brief period of recovery.
The pullback from above 50 suggests that buying pressure has weakened, and PI is entering a more neutral zone, where neither bulls nor bears are in full control.
The quick reversal also reflects uncertainty in the current price trend.
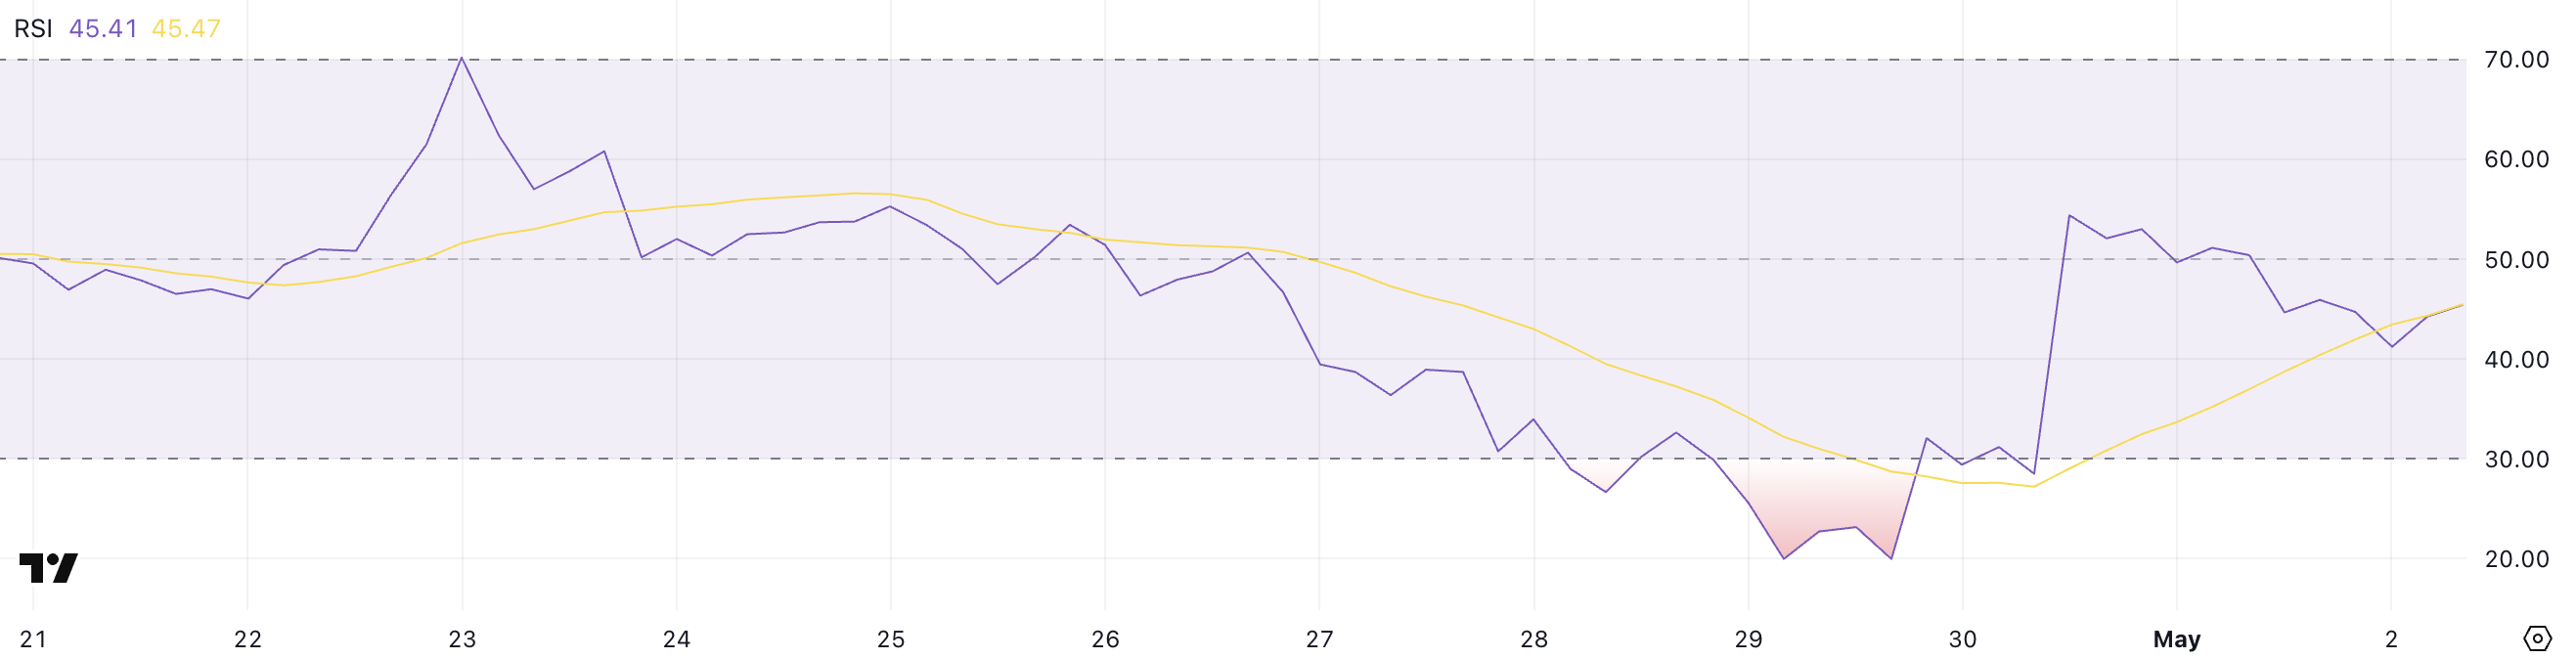
The Relative Strength Index (RSI) is a momentum oscillator ranging from 0 to 100, commonly used to identify overbought or oversold conditions.
Readings above 70 suggest an asset may be overbought and due for a correction, while readings below 30 indicate oversold conditions and potential for a bounce. Values between 30 and 70 are considered neutral, with 50 as the key pivot point.
PI’s current RSI at 45.41 is below that threshold, hinting at a slight bearish lean unless the metric turns back upward. If RSI continues to decline, it may reflect growing selling pressure and a risk of further price weakness.
Pi Network Hovers Near Key Support With Bearish EMAs
PI price is trading just above a key support at $0.59, with bearish pressure building.
If this level is tested and broken, the next important supports lie at $0.547 and $0.40, potentially exposing the token to a deeper correction.
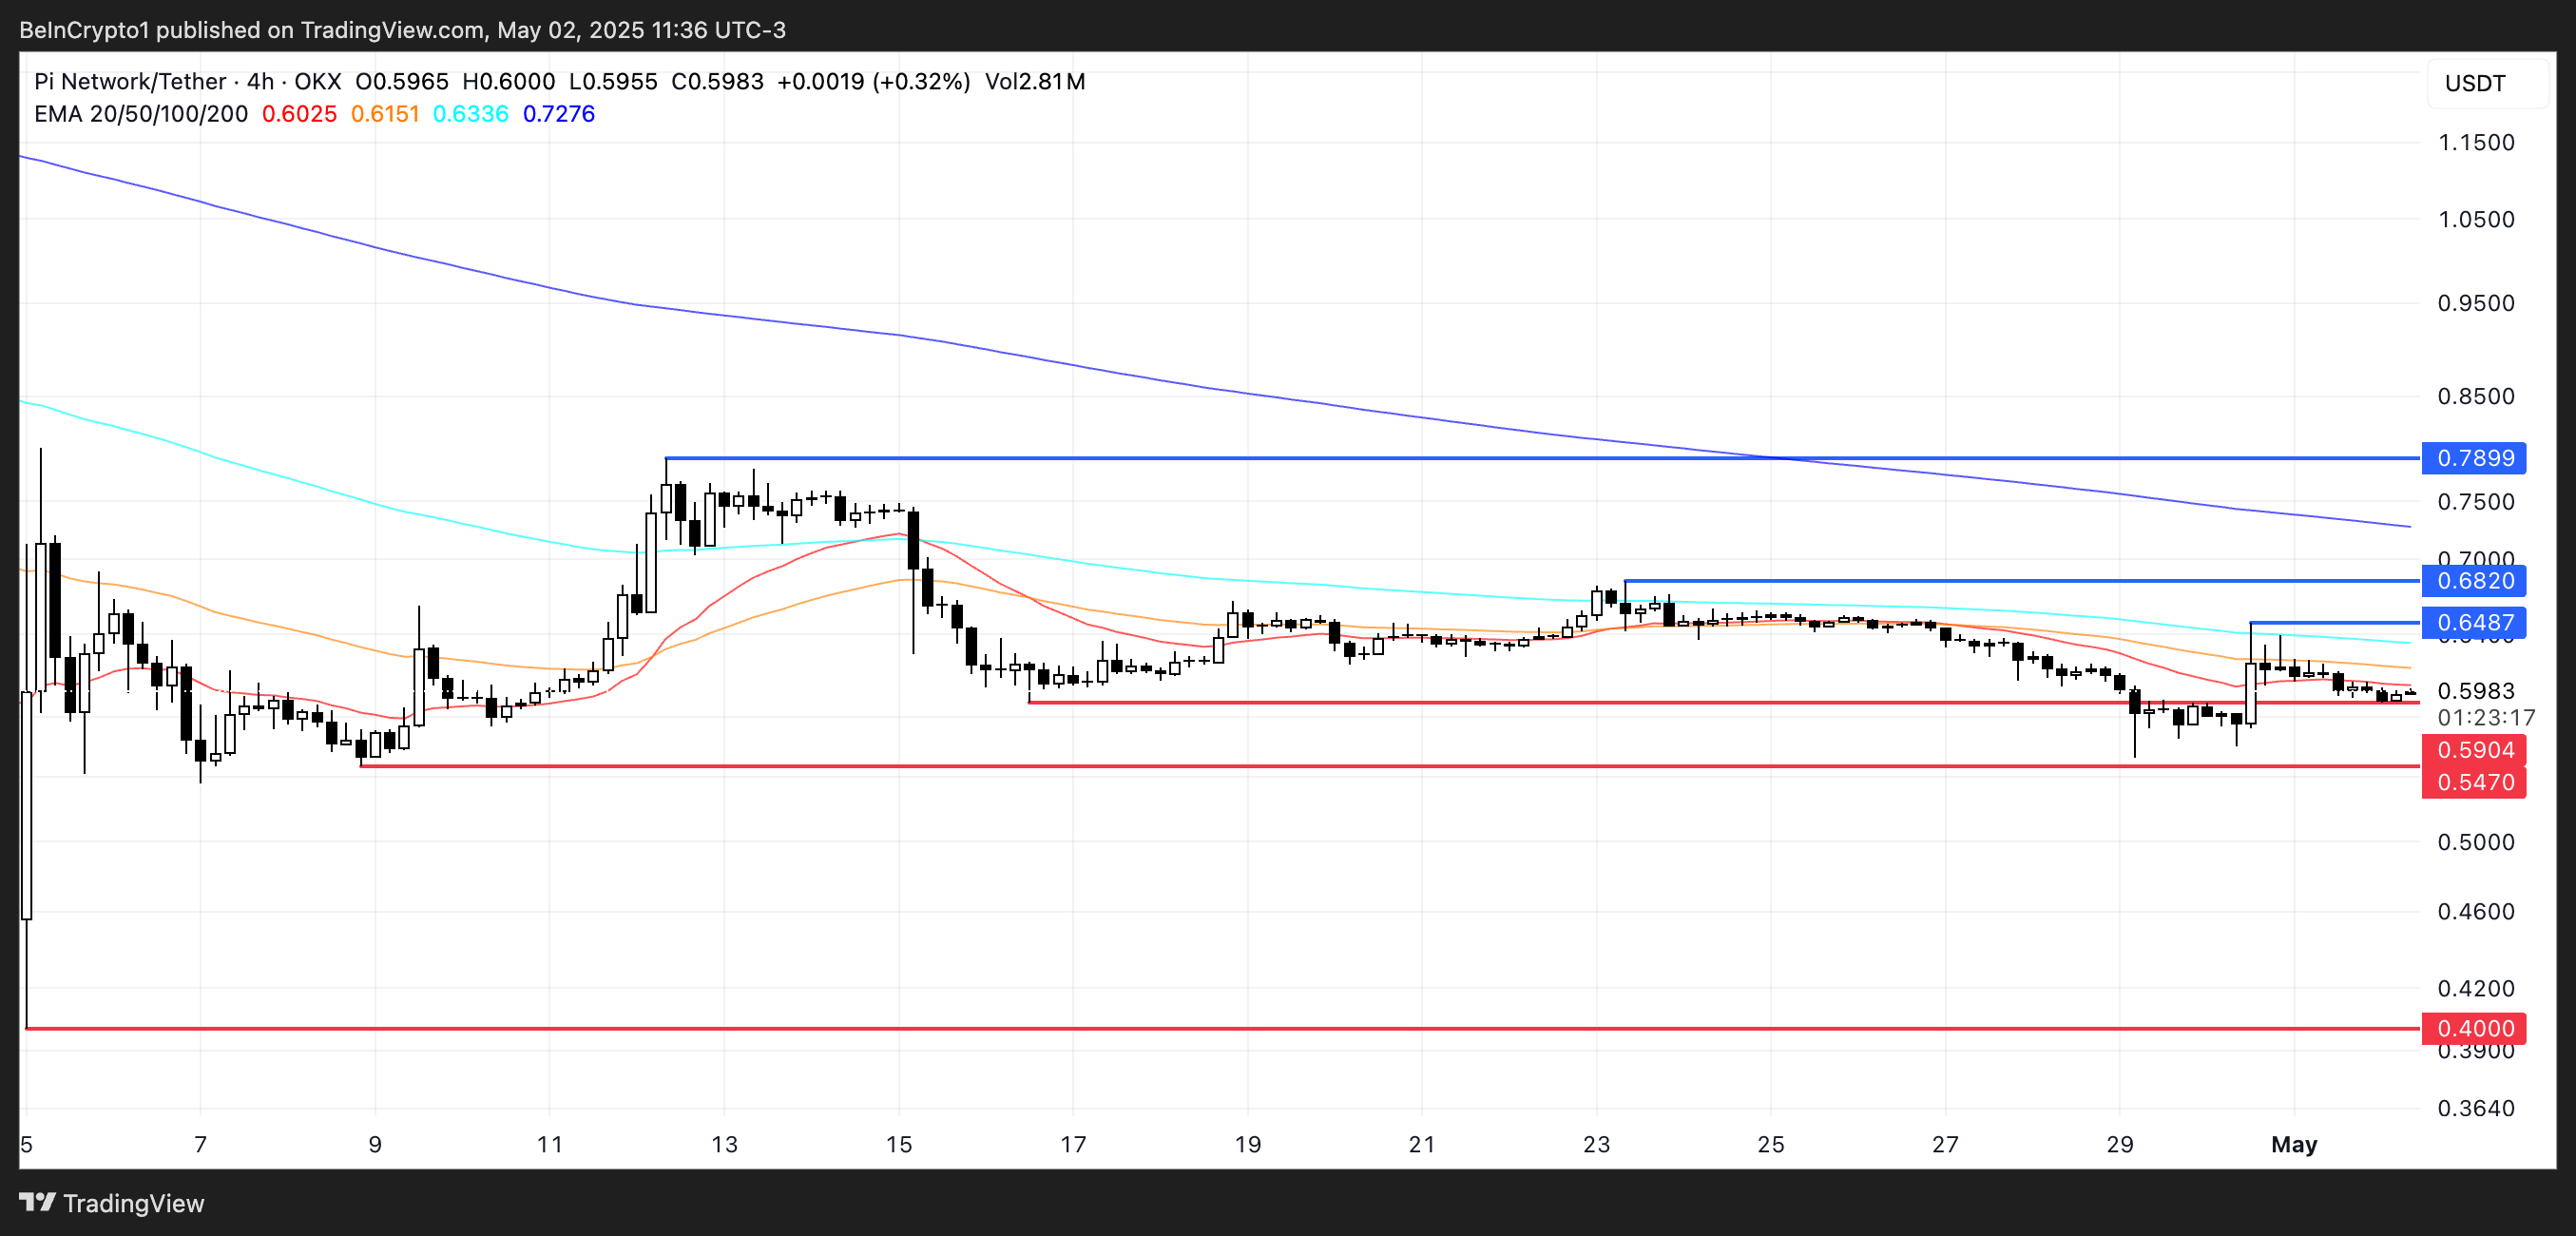
The Exponential Moving Averages (EMAs) remain in a bearish alignment, with short-term EMAs positioned below the long-term ones. This structure typically signals that the broader trend is still downward.
However, if the trend reverses and buyers step in, PI could climb to test resistance at $0.648, followed by $0.682.
A breakout above both—especially if supported by volume and a bullish EMA crossover—could push the price toward $0.789, signaling a shift toward a more sustained uptrend.
The post Pi Network Crashes Again After a Brief Rally – What’s Next for PI? appeared first on BeInCrypto.