
Most of the coins have returned to the green area at the end of the week, according to CoinStats.
SHIB/USD
SHIB is an exception, falling by 0.31% since yesterday.
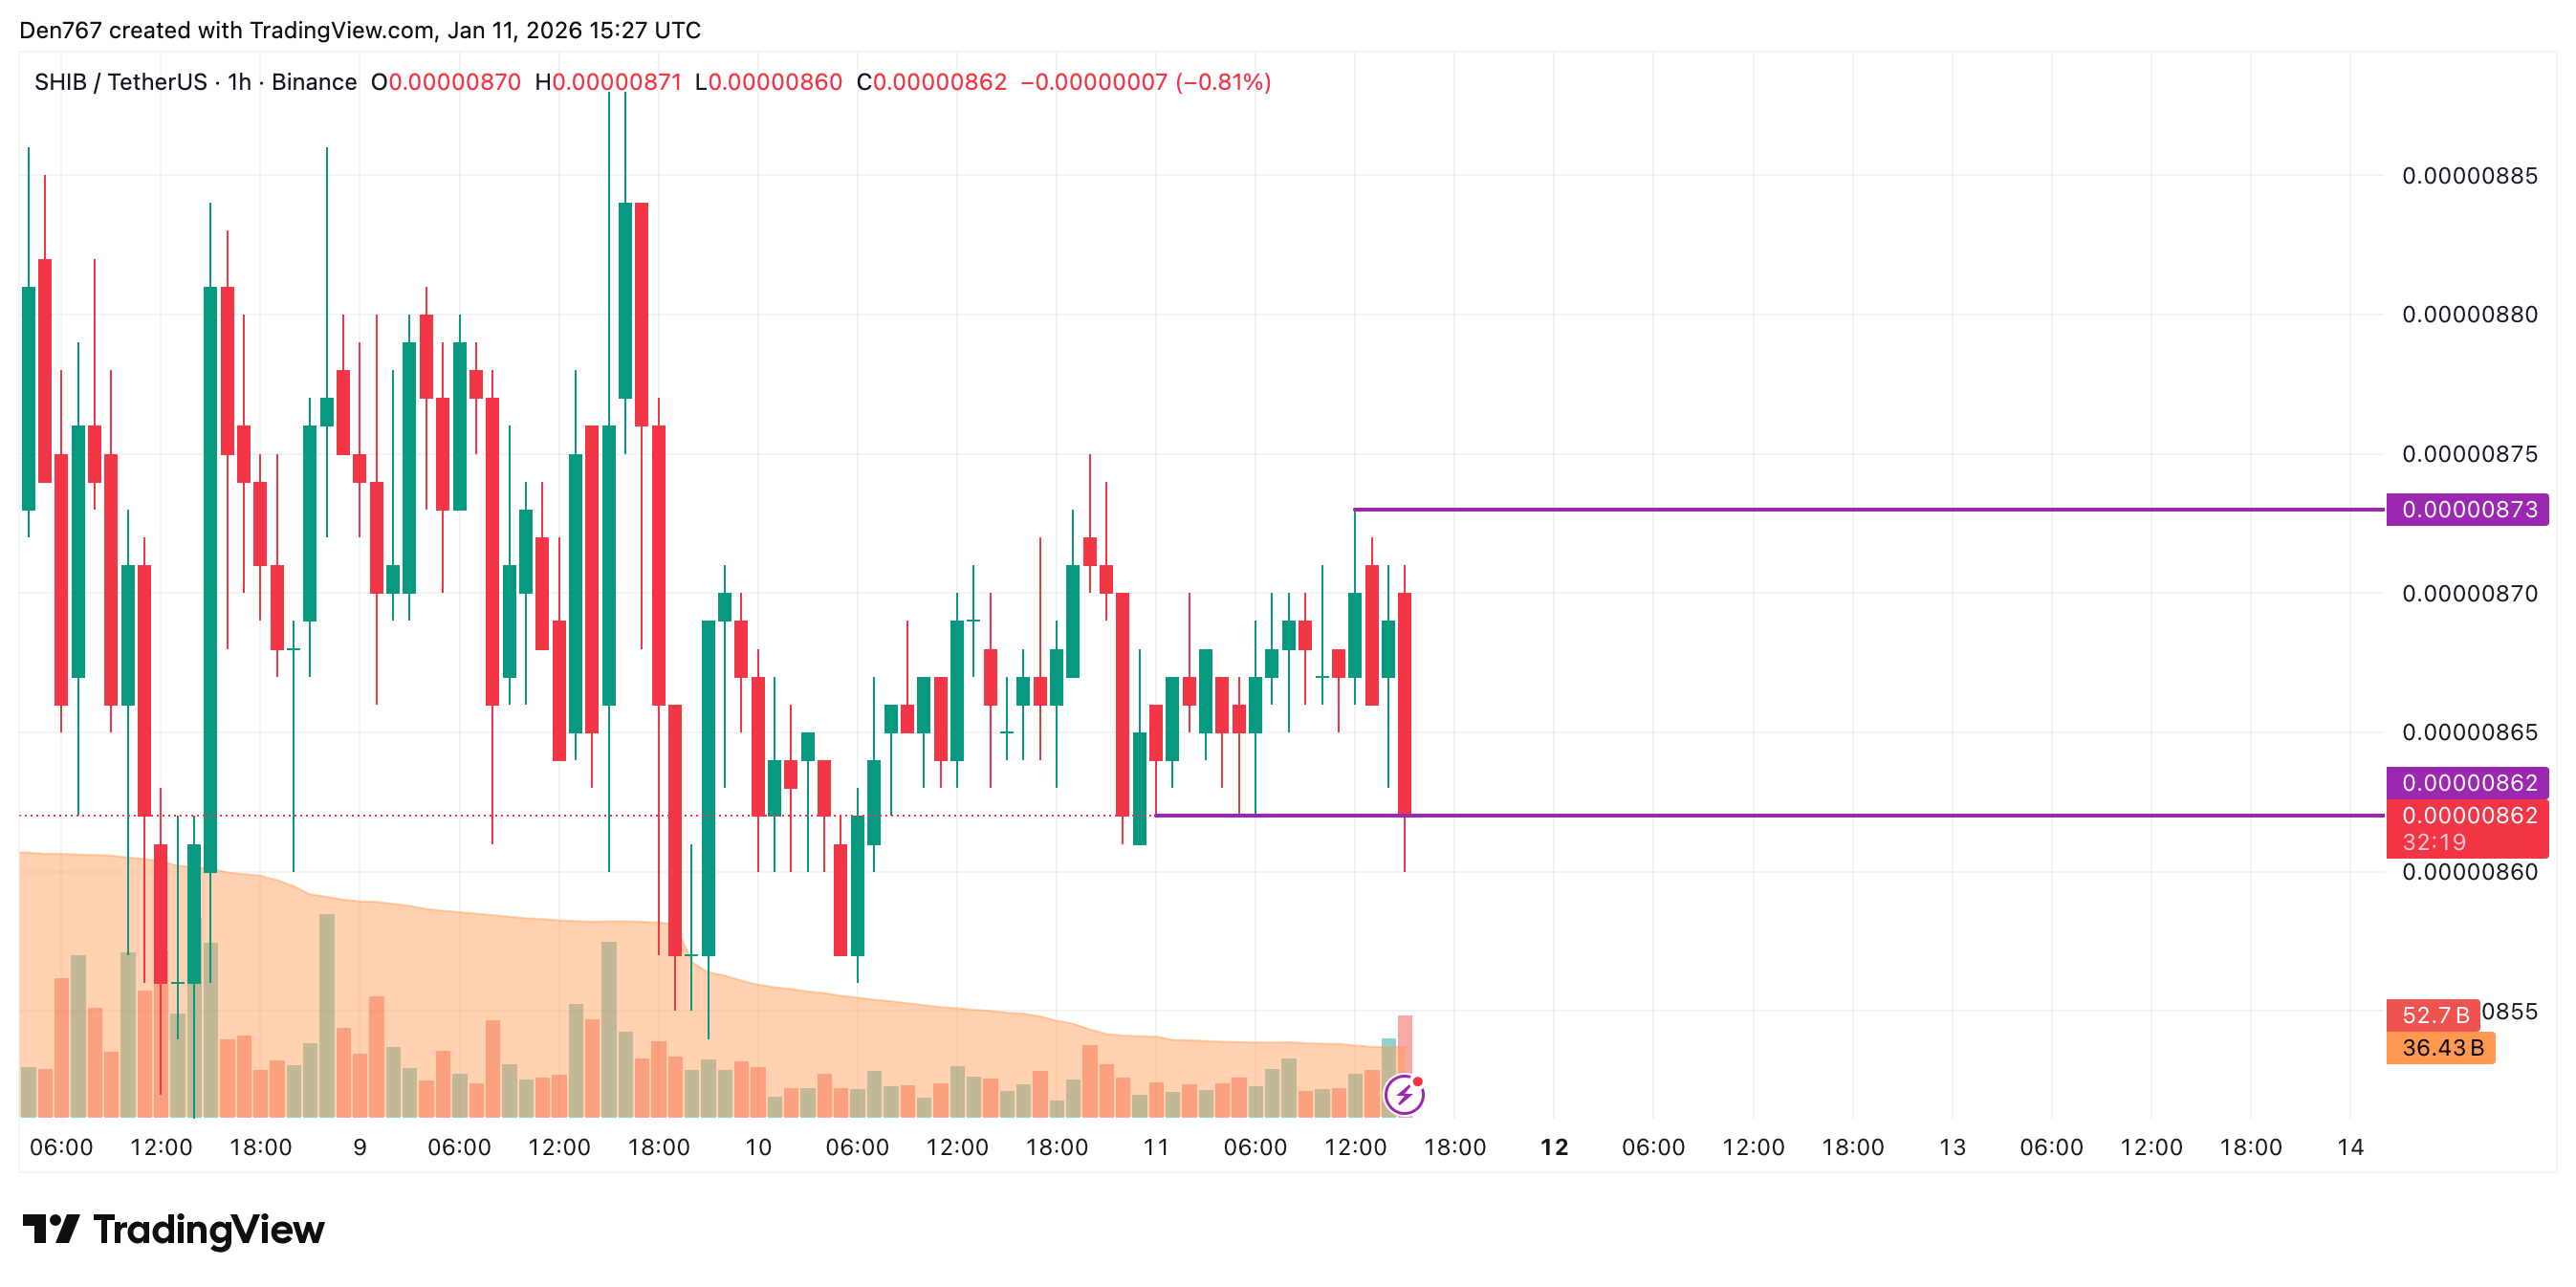
On the hourly chart, the rate of SHIB is looking bearish. The price is breaking the local support at $0.00000862. If a breakout happens, the drop is likely to continue to the $0.00000850 area.
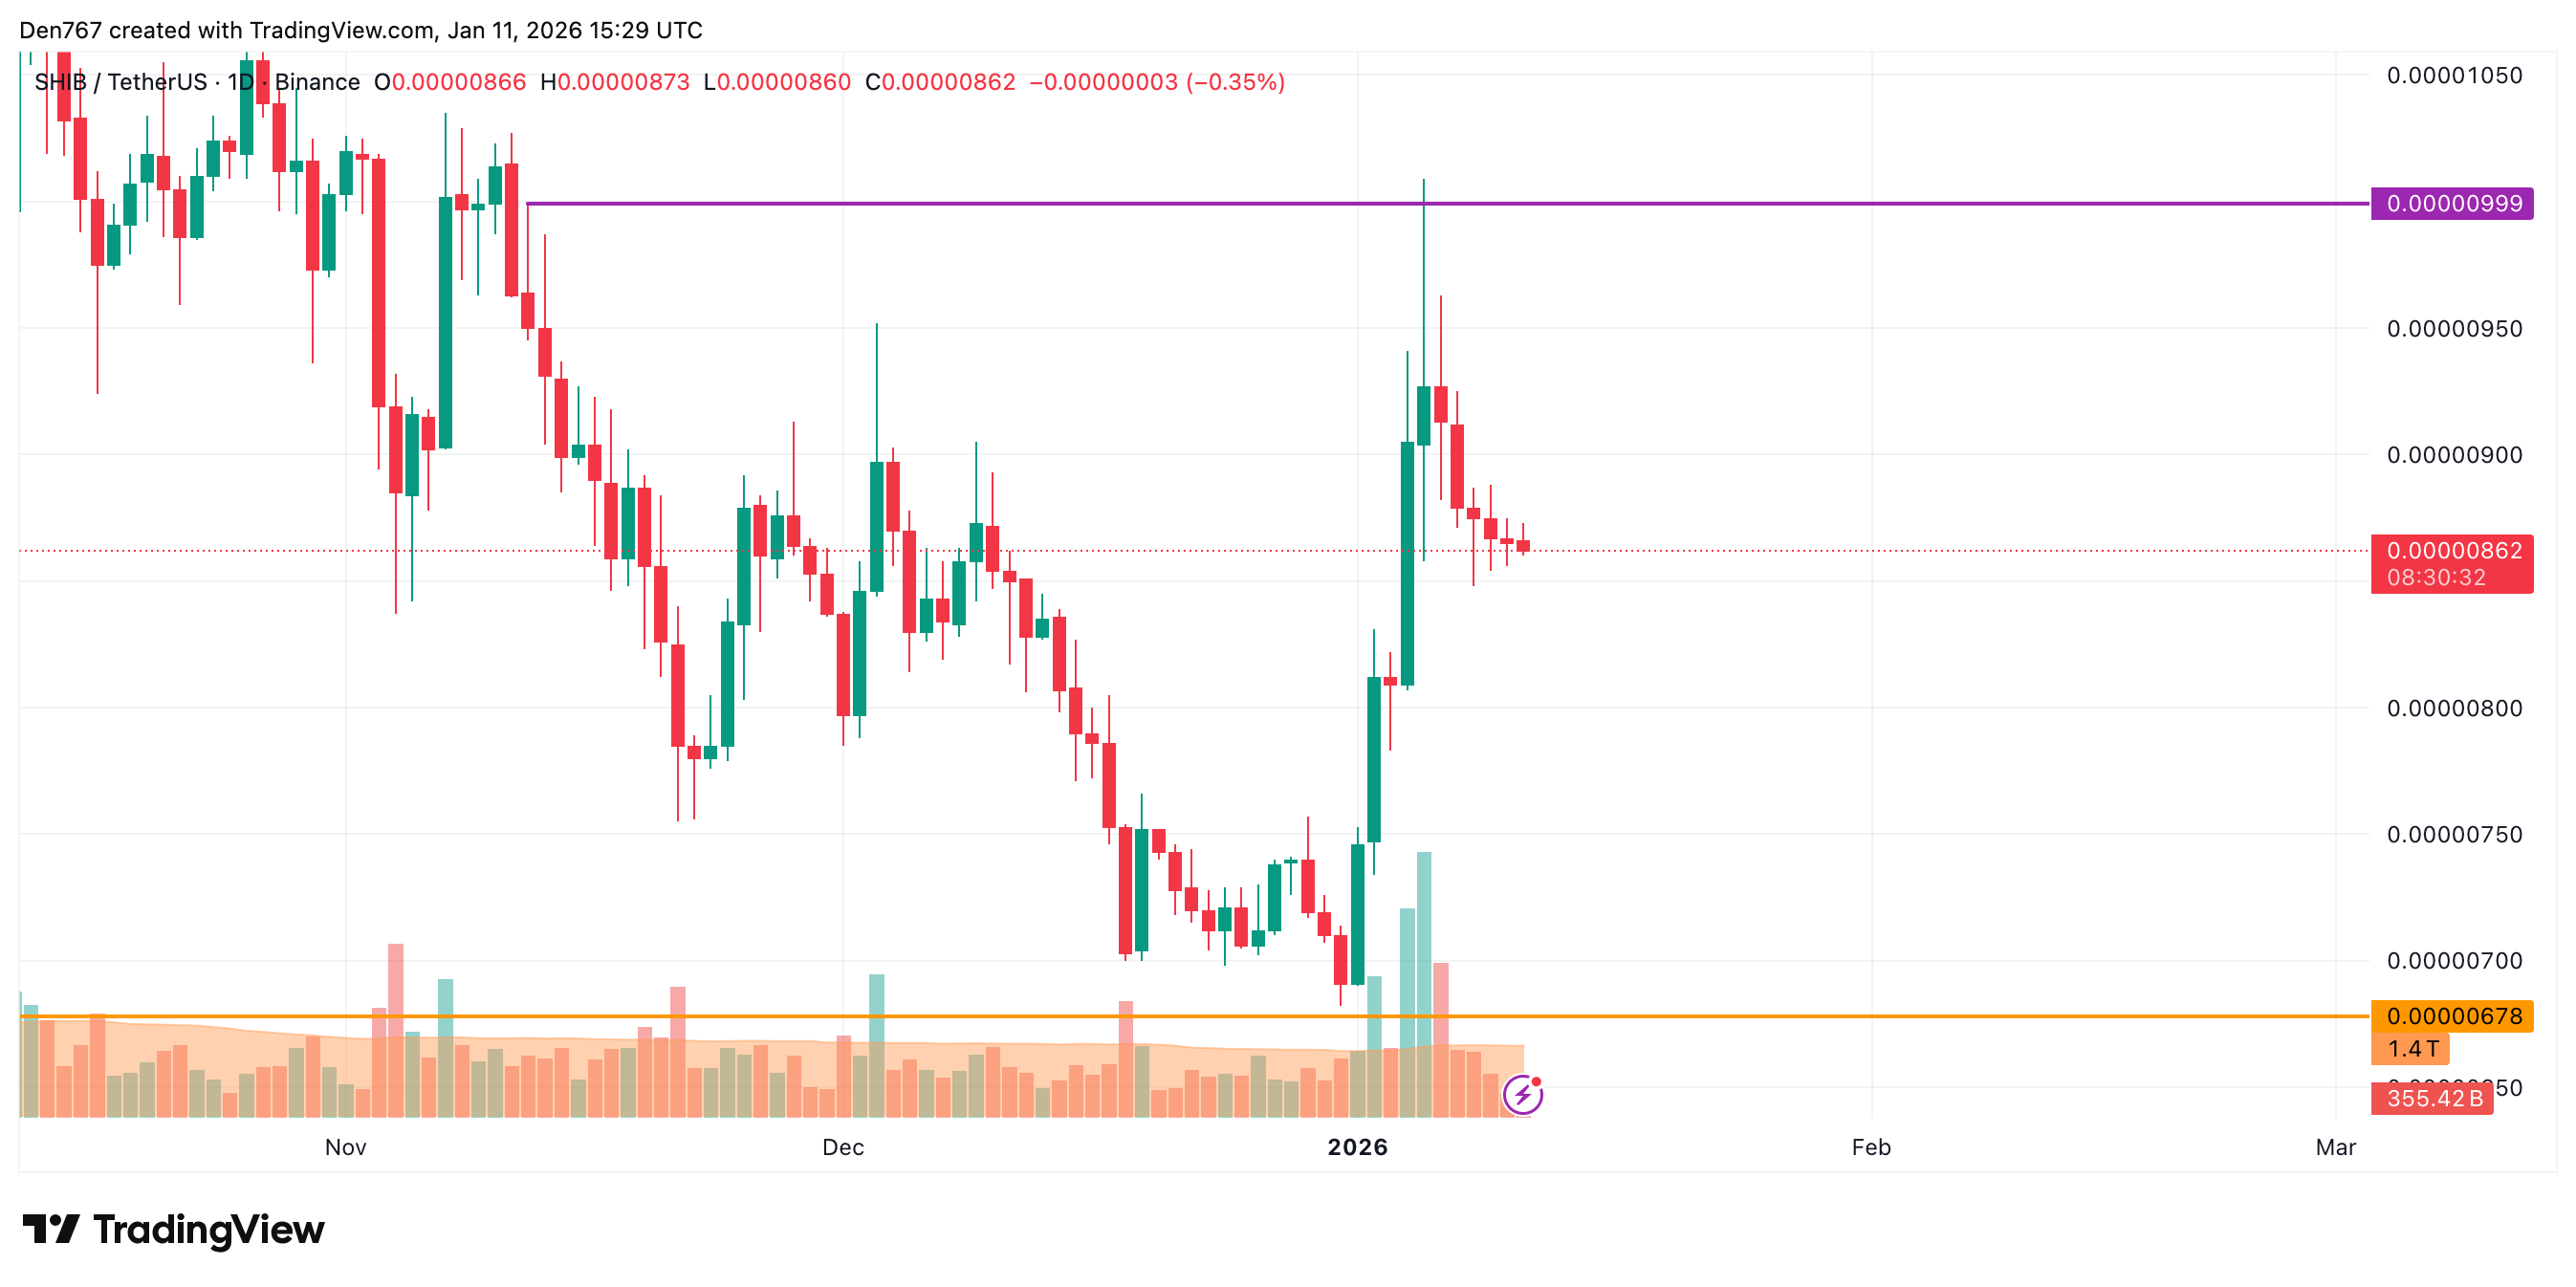
On the bigger time frame, the price of SHIB is far from the key levels. In this case, one should focus on the interim zone of $0.00000850.
You Might Also Like

If the daily bar closes below that range, the accumulated energy might be enough for a test of the $0.0000080 mark.
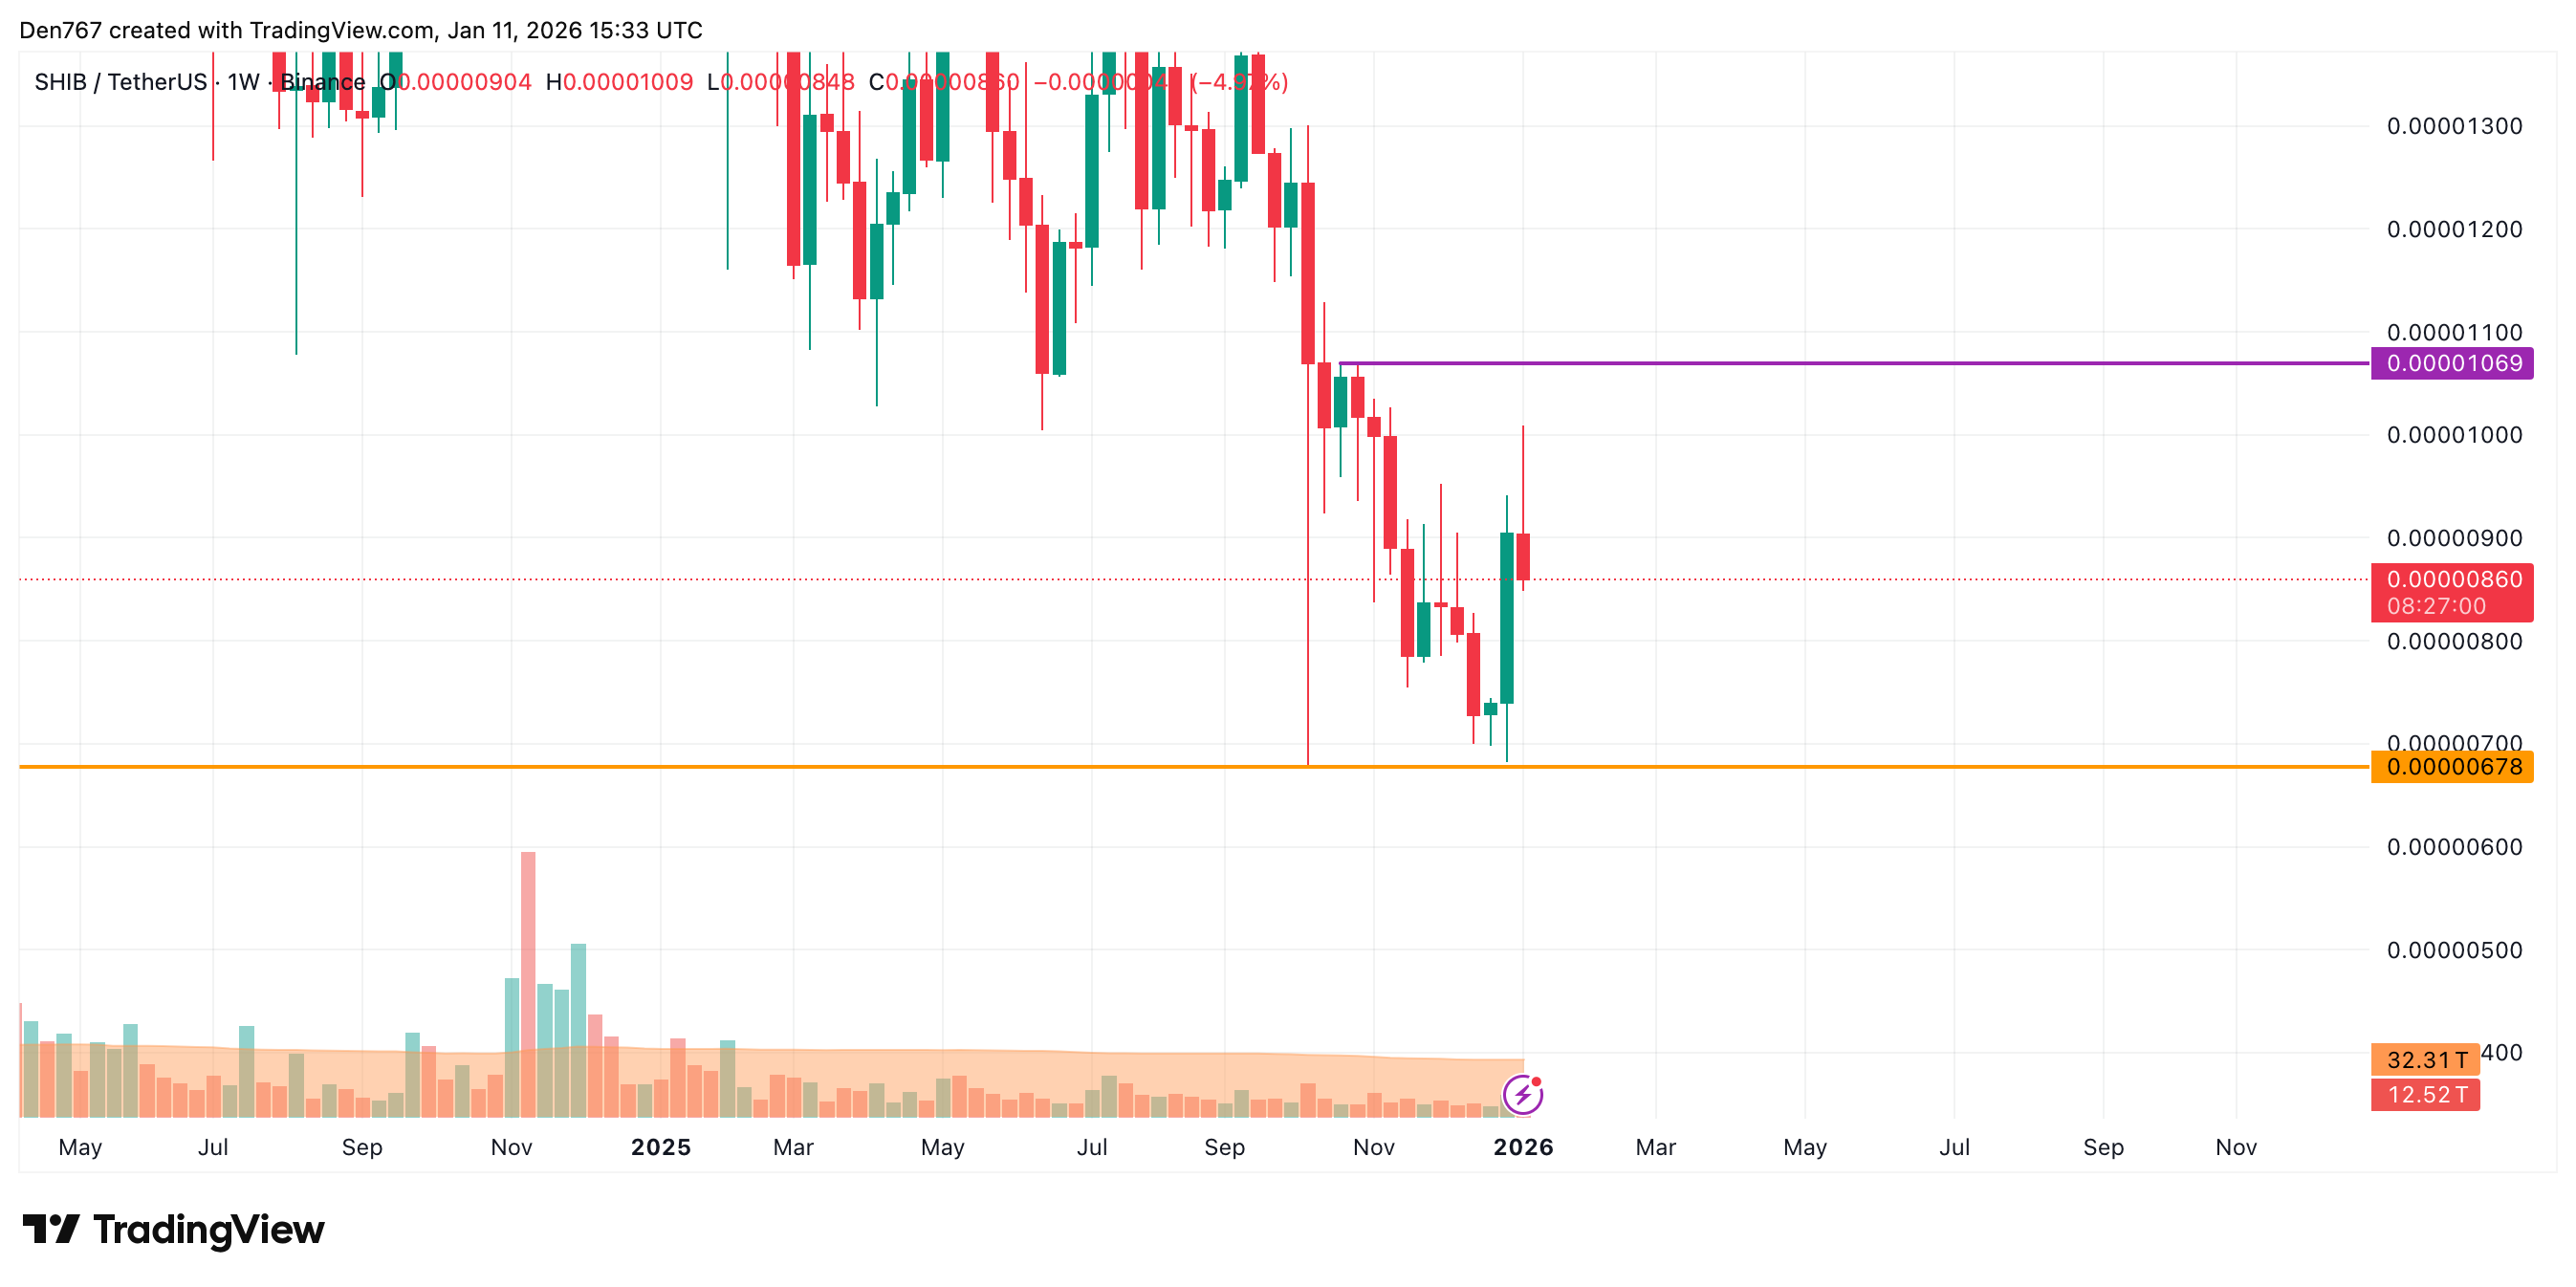
From the midterm point of view, bulls have failed to maintain the growth. If the situation does not change by the end of the day, there is a chance to witness a decline to the $0.00000750-$0.0000080 range by the end of the month.
SHIB is trading at $0.00000860 at press time.