The Shiba Inu (SHIB) price made a failed breakout attempt on November 27 and has fallen since.
Despite the decrease, SHIB still trades inside a corrective pattern. Will it break out?
Shiba Inu Fails to Break Out
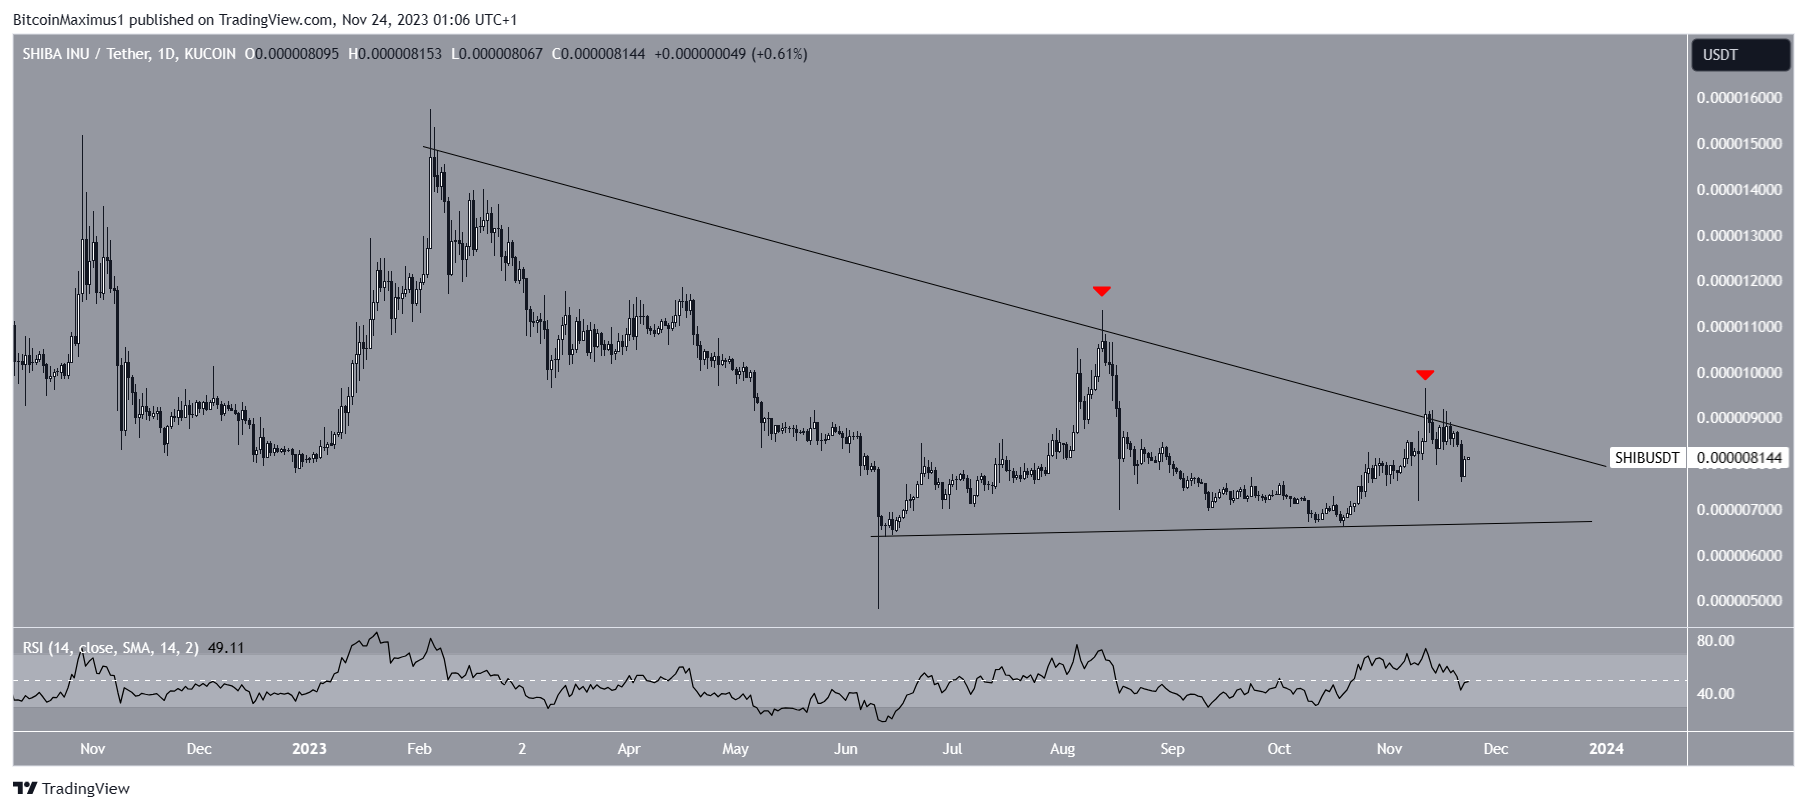
The weekly timeframe technical analysis shows that Shiba Inu has decreased since January. The decrease has been contained under a descending resistance trend line.
Until now, the trend line has caused numerous rejections, three of which are in November (red icons). The rejections created long upper wicks, considered signs of selling pressure.
The SHIB price has fallen since the most recent rejection on November 27.
Since June, the SHIB price has also followed an ascending support trend line, which creates a symmetrical triangle when combined with the aforementioned resistance.
With the Relative Strength Index (RSI) as a momentum indicator, traders can determine whether a market is overbought or oversold and decide whether to accumulate or sell an asset.
Bulls have an advantage if the RSI reading is above 50 and the trend is upward, but if the reading is below 50, the opposite is true. The daily RSI is at 50, failing to confirm the trend’s direction.
Read More: Best Upcoming Airdrops in 2023
SHIB Price Prediction – When Will Breakout Transpire?
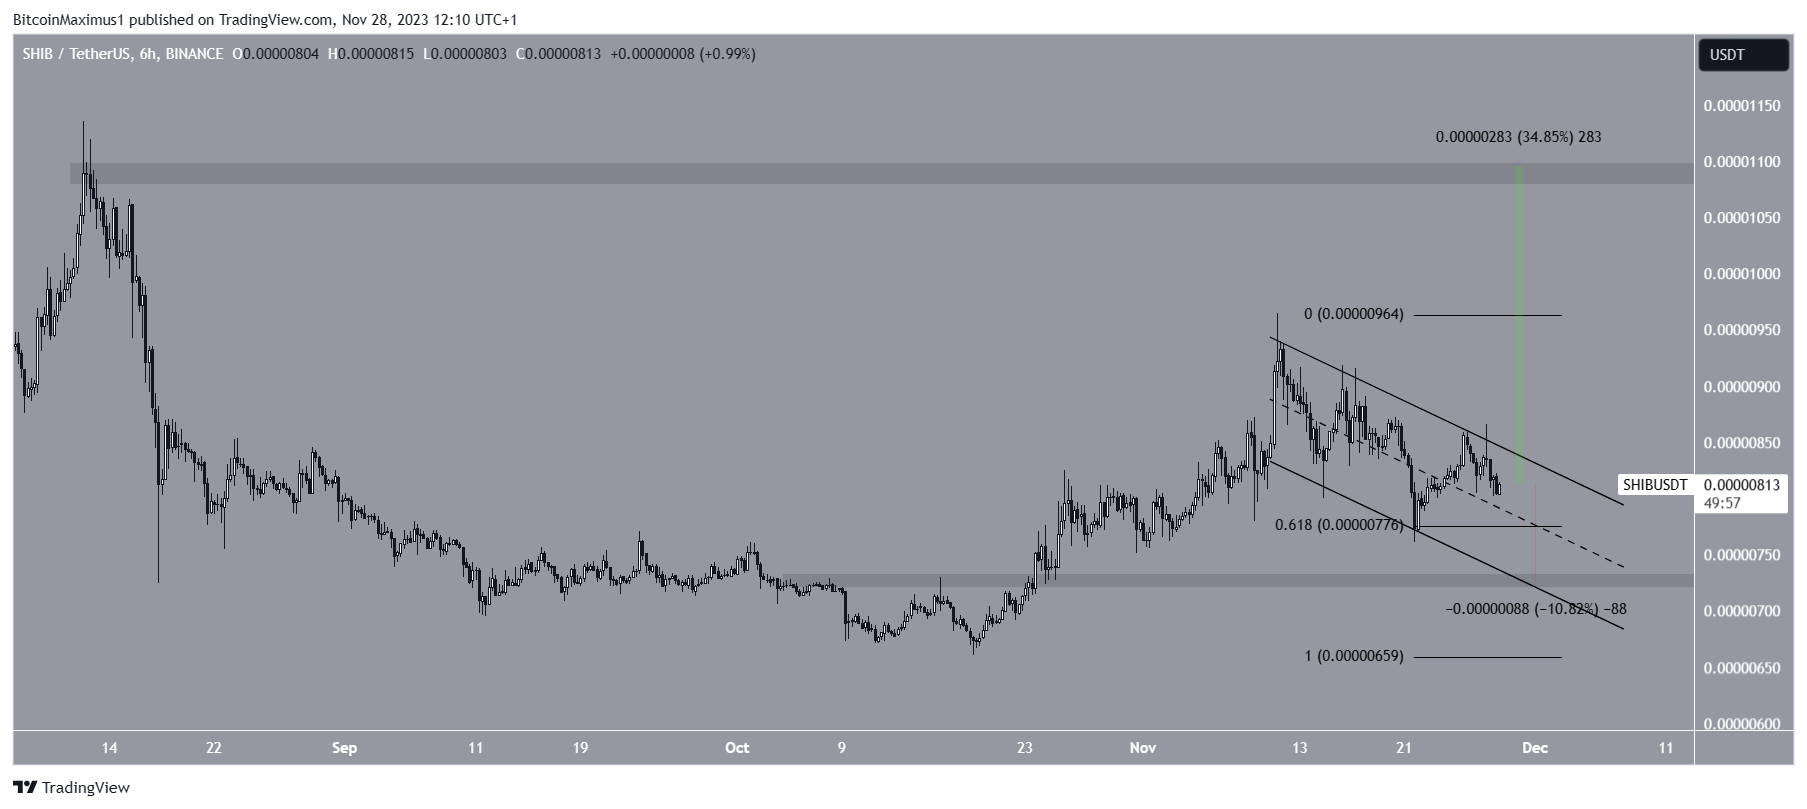
The six-hour timeframe chart shows that the SHIB price has decreased inside a descending parallel channel since November 11. Such channels usually contain corrective movements, meaning that an eventual breakout from the pattern will be likely.
On November 22, SHIB bounced at the 0.618 Fib retracement support level, which also coincided with the channel’s support trend line. However, the SHIB price failed to break out from the channel.
Read More: Best Upcoming Airdrops in 2023
Cryptocurrency trader ChartMonkeyBTC believes that the SHIB price will increase significantly in the short-term. He stated that:
Price is showing resistance at the red trend line. After valid breakout, a 100%+ profit is possible. Trade based on own discretion.
It is also worth noting that 36 million SHIB tokens were burned during the past 24 hours, while 320 million over the past seven days. Whether the SHIB price breaks out from the channel or gets rejected will likely determine the future trend’s direction.

A breakout from the channel can lead to a 35% SHIB price increase, reaching the next resistance at $0.0000105. On the other hand, failure to do so will lead to a 10% drop to the closest support at $0.0000072.
For BeInCrypto‘s latest crypto market analysis, click here.
Top crypto platforms in the US | November 2023
![]()
Paybis
Paybis” target=”_blank”>No fees for 1st swap →
![]()
MoonPay
MoonPay” target=”_blank”>0% fee on 1st trade
![]()
Coinbase
Coinbase” target=”_blank”>$200 for sign up →
![]()
iTrustCapital
iTrustCapital” target=”_blank”>Crypto IRA →
![]()
Uphold
Uphold” target=”_blank”>No withdrawal fee →
![]()
eToro
eToro” target=”_blank”>$10 for first deposit →
![]()
BYDFi
BYDFi” target=”_blank”>No KYC trading →
The post Shiba Inu (SHIB) Price Locked in a Corrective Pattern – Will It Break Out? appeared first on BeInCrypto.
