Solana’s price reversed after finding support. Will it last?
Key Support levels: $17
Key Resistance levels: $20
1. Support Found
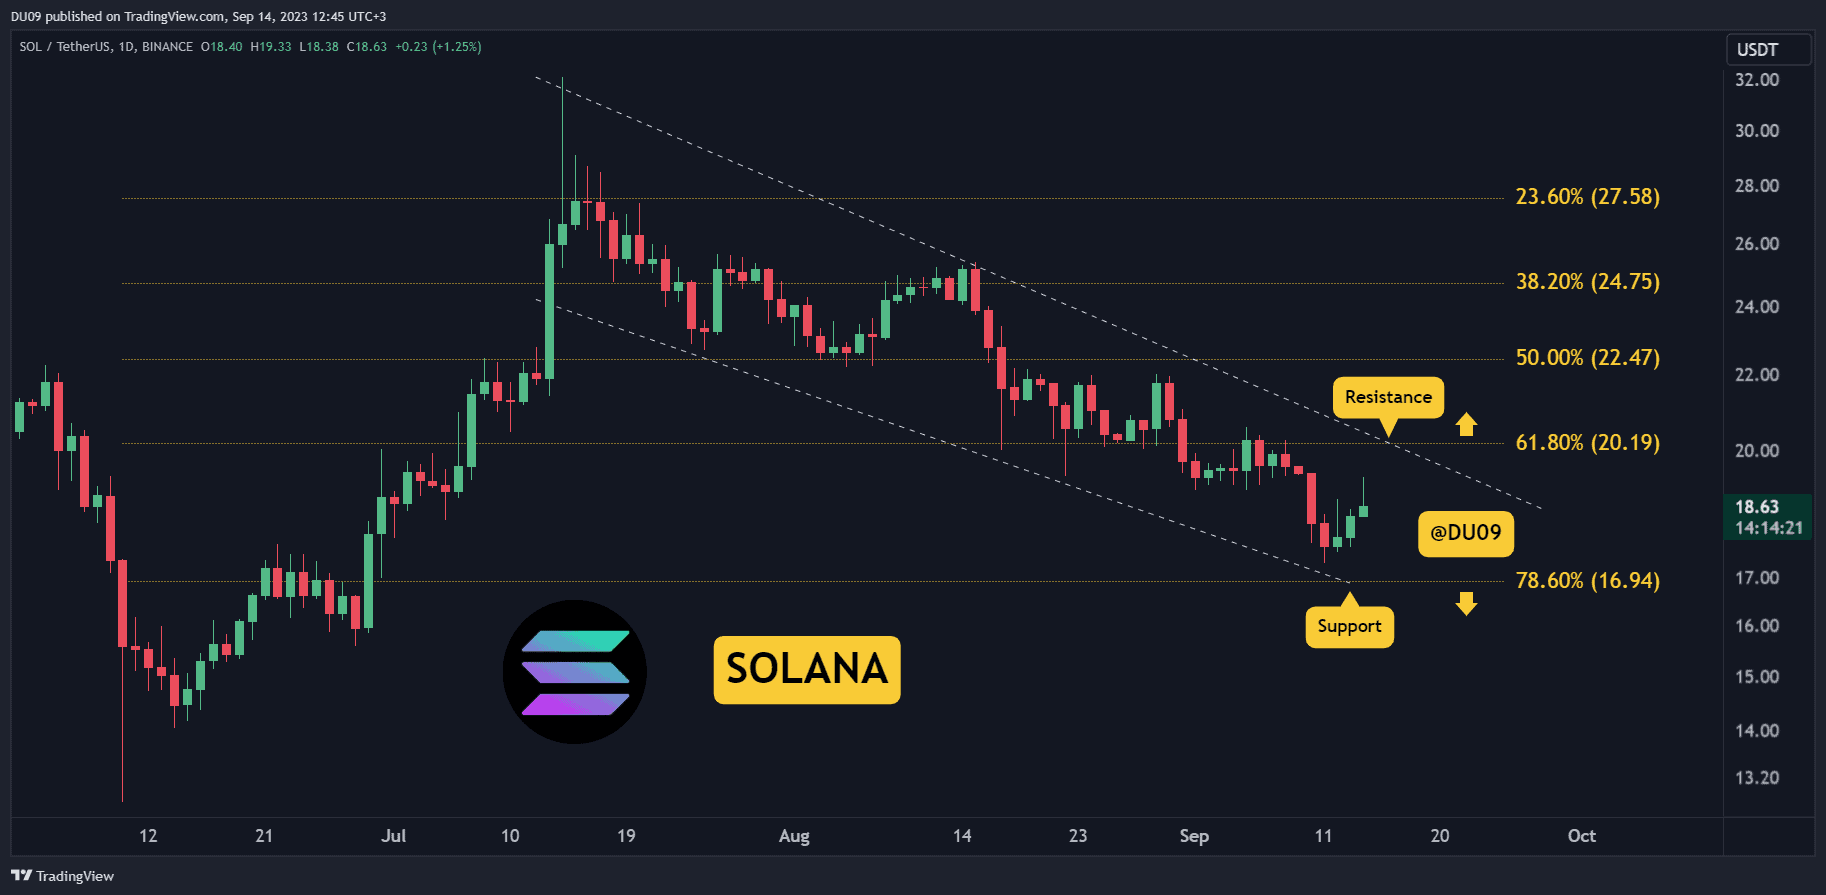
The price managed to hold above the $17 support and buyers started to show interest again. This led the price into a relief rally in the past few days. However, the resistance at $20 may stop any bullish momentum since sellers could return there.
2. Downtrend Still Intact
Despite this bounce, the price is still found in a major downtrend. Unless Solana breaks above $20 and turns that level into support, the bias remains bearish. Watch closely the level at $20 as it will be decisive.
3. Reversal Soon?
The histogram on the daily MACD has been making higher lows which opens up the possibility of a sustained reversal later on. The moving averages also appear keen to do a bullish cross a second time this month. It is too early to turn bullish, but these are promising signs.
Bias
The bias for SOL is bearish so long the resistance holds.
Short-Term Prediction for SOL Price
Expect a test of the resistance at $20. Any failure there and Solana will likely continue its downtrend. If so, watch the support levels at $17 and $15.
Binance Free $100 (Exclusive): Use this link to register and receive $100 free and 10% off fees on Binance Futures first month (terms).
PrimeXBT Special Offer: Use this link to register & enter CRYPTOPOTATO50 code to receive up to $7,000 on your deposits.
Disclaimer: Information found on CryptoPotato is those of writers quoted. It does not represent the opinions of CryptoPotato on whether to buy, sell, or hold any investments. You are advised to conduct your own research before making any investment decisions. Use provided information at your own risk. See Disclaimer for more information.
Cryptocurrency charts by TradingView.
