
Join Our Telegram channel to stay up to date on breaking news coverage
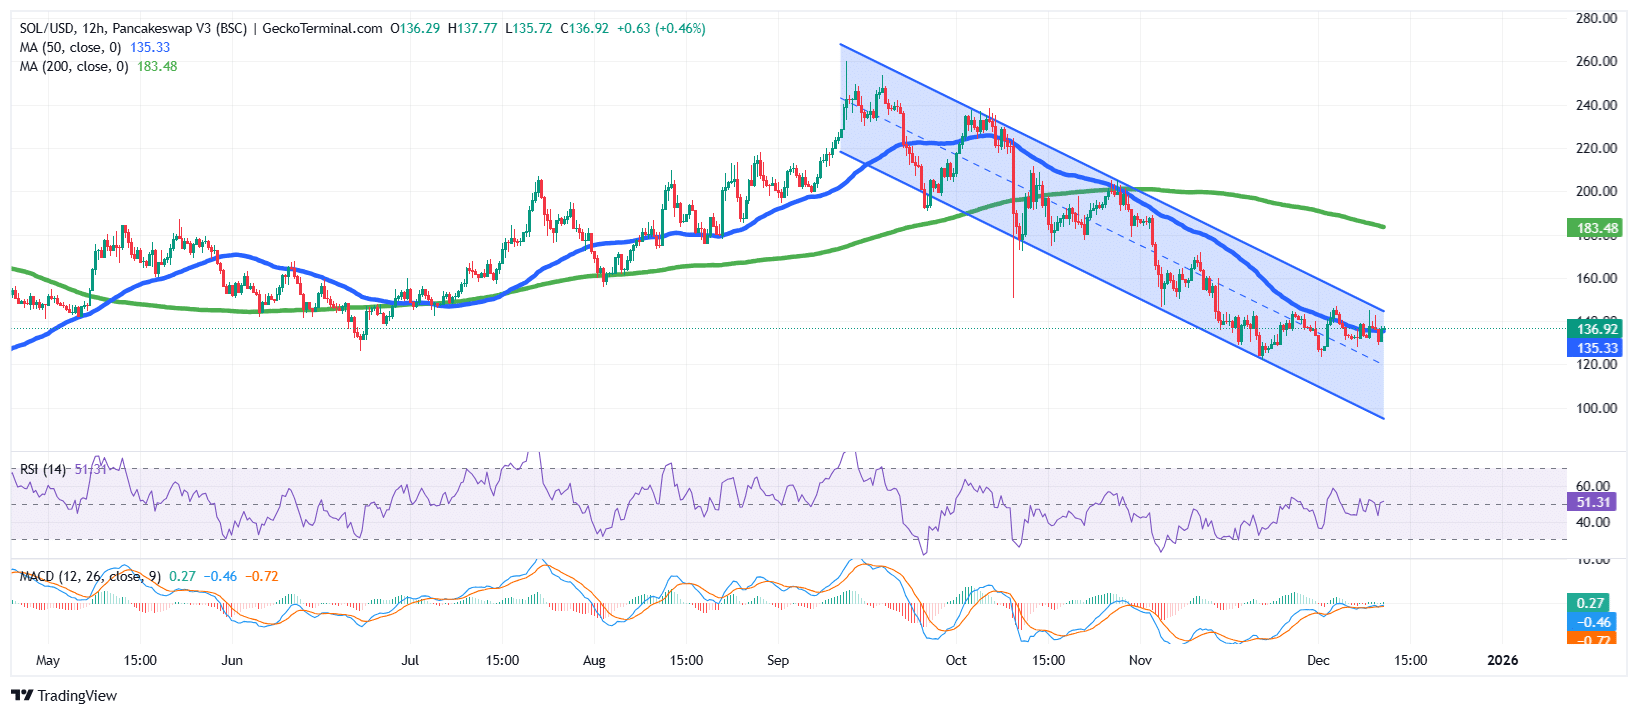
The Solana price rose over 5% in the past 24 hours to trade at $136.92 as of 12:35 a.m. EST on trading volume that plunged 24% to $5.5 billion.
This comes as Hex Trust announced that it is launching Wrapped XRP (wXRP) to enhance the Ripple token’s decentralized finance (DeFi) and cross-chain utility.
As a result, wXRP will be tradable alongside RLUSD on Ethereum and other supported chains, including Solana.
BREAKING: XRP is coming to Solana 🔥 pic.twitter.com/LabnKkLs71
— Solana (@solana) December 12, 2025
In another development, Anthony Scaramucci, founder of SkyBridge Capital, told the Breakpoint conference that Solana could surpass Ethereum in market value.
“I think it will flip Ethereum,” Scaramucci said, adding that he still loves ETH and Avalanche.
ANTHONY SCARAMUCCI ON SOLANA $SOL: “I THINK IT WILL FLIP ETHEREUM.” pic.twitter.com/Id942yiDVv
— The Wolf Of All Streets (@scottmelker) December 11, 2025
Scaramucci’s comments revived the two chains’ long-running Layer-1 rivalry, which has intensified as Solana’s ecosystem continues expanding with new infrastructure, developer tools, and institutional pipelines.
Despite the 24-hour surge, the Solana price is still down over 11% in the last week. Can this recovery lead to a sustained reversal of the bullish trend?
Solana Price Preparing For A Potential Reversal Attempt
After rallying strongly to the $250 region in September, the SOL price entered a sharp correction phase, sliding back into a well-defined falling channel pattern that has dominated the market structure since mid-September, according to the 12-hour TradingView chart.
This sustained downward pressure pushed the Solana price below both the 50-day and 200-day Simple Moving Averages (SMAs), reinforcing the broader bearish market environment.
As the selloff continued, the price repeatedly respected the boundaries of the descending channel, forming lower highs and lower lows.
However, support near the $125 zone has since helped stabilize Solana’s price, leading to a modest recovery. However, sellers have successfully capped the price to trade below the $147 resistance.
SOL is currently trading just below the top of the falling channel, attempting to push higher after reclaiming the 50-day SMA ($135.33). The price of SOL remains below the 200-day SMA ($183.48), a level that continues to define the longer-term bearish trend.
Meanwhile, the Relative Strength Index (RSI) is hovering around 51, indicating a neutral but improving momentum as the indicator climbs away from its November lows. This reflects early signs of a potential shift, though buyers continue to face resistance.
On the momentum side, the Moving Average Convergence Divergence (MACD) shows a mild bullish crossover, as the blue MACD line has crossed above the orange signal line.
SOL Price Prediction
Based on the current chart structure, the SOL price is consolidating near the convergence of the 50-day SMA and the upper boundary of the falling channel.
If SOL decisively breaks above the channel resistance around $147, a relief rally toward the mid-range structure at $178 becomes likely. A stronger bullish continuation could open the path toward the 200-day SMA region around $183, a major hurdle that would determine whether a complete trend reversal is possible.
However, if the Solana price fails to maintain momentum and slips back below the $126 support area, bearish pressure may return. A breakdown below this level could send Solana to the $115 support area.
Related News:
Best Wallet – Diversify Your Crypto Portfolio

- Easy to Use, Feature-Driven Crypto Wallet
- Get Early Access to Upcoming Token ICOs
- Multi-Chain, Multi-Wallet, Non-Custodial
- Now On App Store, Google Play
- Stake To Earn Native Token $BEST
- 250,000+ Monthly Active Users
Join Our Telegram channel to stay up to date on breaking news coverage