
Join Our Telegram channel to stay up to date on breaking news coverage
The Solana price plunged 3% in the past 24 hours to trade at $136.60 as of 4:29 a.m. EST on trading volume that surged 69% to $9.5 billion.
This comes as VanEck launched its Solana ETF (exchange-traded fund) on Nasdaq. VanEck is waiving its sponsor fee for VSOL at launch for the first $1 billion in assets or until February 17, 2026, whichever comes first.
VSOL became the second spot SOL ETF in the US and offers a staking yield of 6.57%.
🚨BREAKING: VanEck’s @Solana ETF goes live for trading, seeding with $7.32 million.pic.twitter.com/4LbSnyZRVG
— SolanaFloor (@SolanaFloor) November 17, 2025
The fund trades on the Cboe BZX Exchange with a 0.30% sponsor fee waived. Meanwhile, SOL Strategies also agreed to waive its 0.28% staking provider fee during the same period.
Gemini Trust Company will be the primary custodian, and Coinbase Custody Trust Company will provide additional custody services.
State Street Bank and Trust Company handle cash custody and fund administration. Van Eck Associates Corporation provided $10 million in seed funding on Oct. 29.
With the ETF opening up a space for institutions to invest, will the Solana price surge?
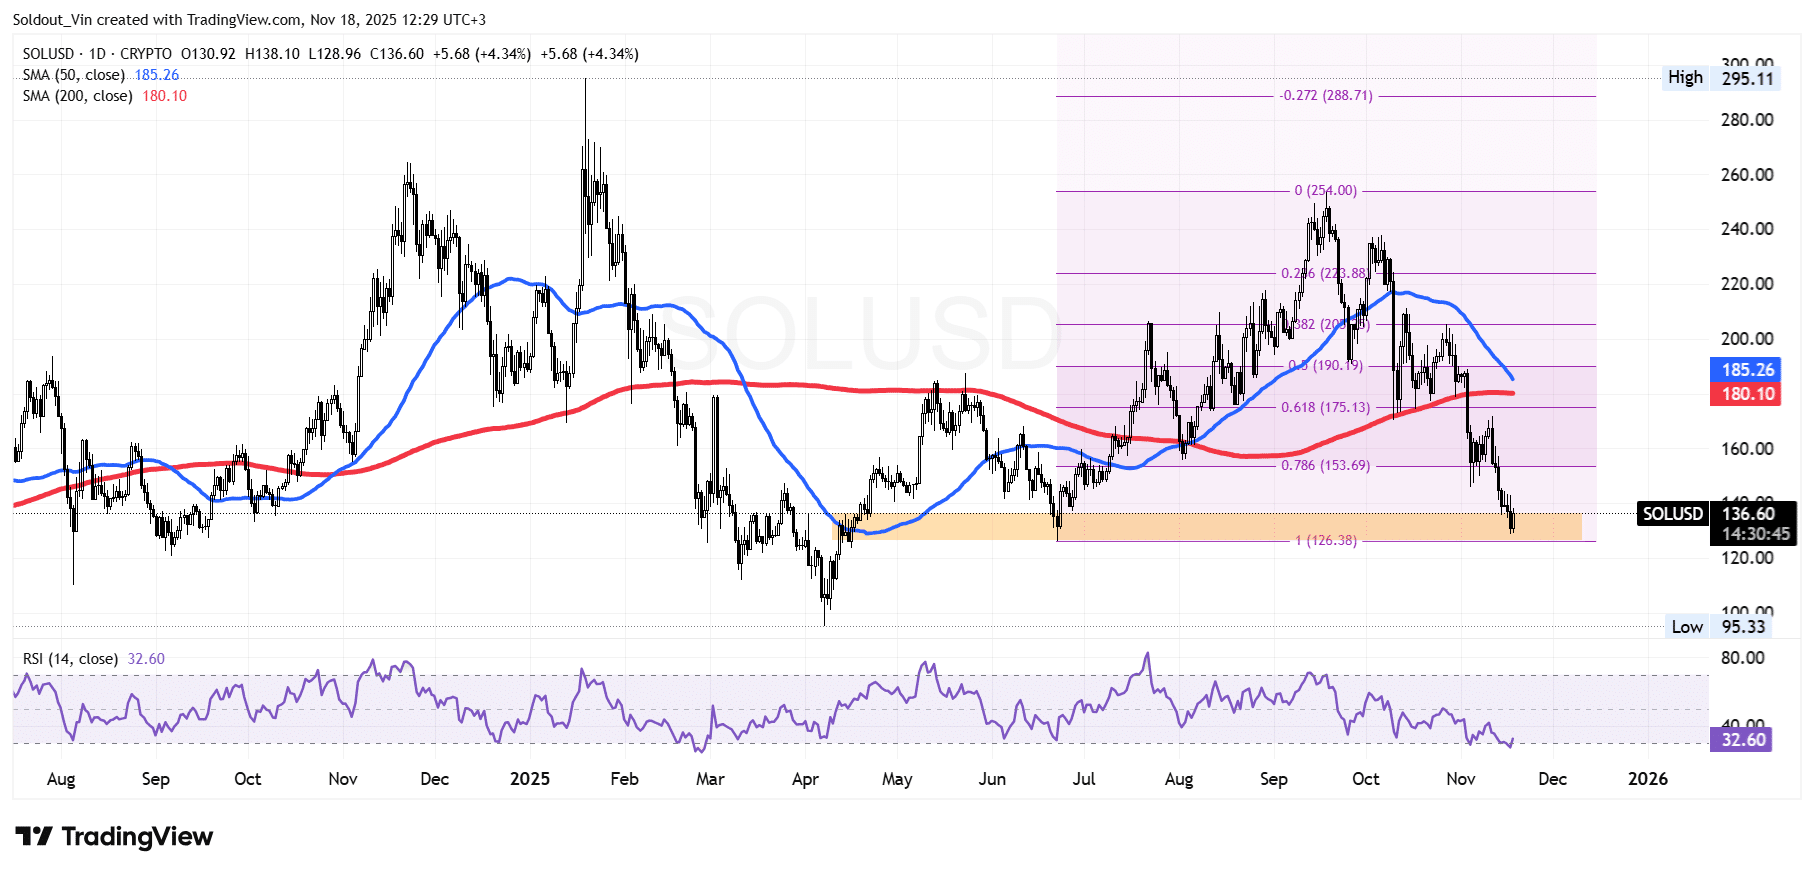
Solana Price Drops Into Key Support Zone As Bearish Pressure Intensifies
After rallying strongly from the $126 zone in June, the SOL price pushed upward toward the $254 region in September.
However, the Solana price encountered some resistance at this level, with the rejection initiating a multi-week corrective phase in which SOL traded within a gradually weakening structure, moving from mild consolidation into a deeper bearish retracement.
Bulls attempted to defend the 0.382 and 0.5 Fibonacci levels in October, but persistent sell pressure forced the price below the 0.618 level at $175 and later under the 0.786 retracement near $153.
This downward pressure has now driven the price of SOL directly into the major demand zone between $126–$135. Solana price action in the last sessions shows a clear touch of this zone following a rapid drop, which cements the overall market uncertainty.
Further strengthening the bearish narrative, the 50-day Simple Moving Average (SMA) has curved sharply downward and currently sits slightly above the 200-day SMA.
Moreover, the Relative Strength Index (RSI) has dropped towards the 30-oversold level, currently at 32. This shows the intensity of the bearish momentum but also suggests that SOL may be approaching conditions where relief bounces are common.
SOL Price Prediction
Based on the SOL/USD chart analysis, the Solana price is exhibiting firm bearish momentum as it trades below both the 50-day and 200-day SMAs and has broken beneath each major Fibonacci retracement level.
If bearish pressure continues and SOL closes decisively below the $126 level, the next likely downside target sits near $110, with further decline potentially extending toward $95.
However, if oversold conditions trigger a buyback for the bulls, initial resistance lies around $153, near the 0.786 Fib level. Further recovery would require reclaiming the $175 zone and breaking above the 50-day SMA, which would weaken the bearish outlook.
Related News:
Best Wallet – Diversify Your Crypto Portfolio

- Easy to Use, Feature-Driven Crypto Wallet
- Get Early Access to Upcoming Token ICOs
- Multi-Chain, Multi-Wallet, Non-Custodial
- Now On App Store, Google Play
- Stake To Earn Native Token $BEST
- 250,000+ Monthly Active Users
Join Our Telegram channel to stay up to date on breaking news coverage