
Bitcoin is currently consolidating quietly around the $110,000 level, with bears pushing for further downside after weeks of volatility. Despite this pullback, many analysts remain confident that the long-term bullish trend is intact, highlighting that such periods of consolidation are common in strong market cycles. While short-term sentiment appears cautious, Bitcoin’s structural support levels remain unbroken, keeping bulls engaged.
According to CryptoQuant insights shared by XWIN Group, the driving forces behind Bitcoin’s price movements have shifted in recent months. Instead of ETF flows being the dominant factor, regional liquidity dynamics have taken center stage. Onchain and exchange data show a recurring pattern: Asian markets frequently ignite the initial move, setting the tone for intraday momentum, while US participants determine whether these moves sustain or fade. This tug-of-war across time zones has added complexity to Bitcoin’s behavior, creating sharp intraday swings followed by broader directional moves.
This evolving market structure underscores the global nature of Bitcoin trading, where liquidity corridors play a critical role in shaping price action. As consolidation deepens, traders are closely watching whether Asia-driven rallies can align with US institutional demand to confirm the next leg higher in Bitcoin’s cycle.
Regional Liquidity ‘War’ Shapes Bitcoin Direction
According to XWIN Research, Bitcoin’s recent price action highlights a fascinating tug-of-war between US institutions and Asian traders. On the US side, Coinbase Netflow and the Coinbase Premium Index (CPI) provide critical insights. Outflows from Coinbase Prime, a platform widely used by institutions, typically signal that US players are moving BTC into custody for long-term accumulation.
The CPI, which measures the price gap between Coinbase (USD) and Binance (USDT), further reinforces this. When the CPI remains positive, it reflects strong US demand, and history shows that rallies supported by a positive CPI tend to sustain rather than fade quickly.
In contrast, Binance Netflow and the Korea Premium Index (KPI) highlight Asian retail and speculative behavior. Heavy inflows into Binance often precede local selling pressure, while outflows indicate dip-buying appetite. The KPI, also known as the “Kimchi Premium,” reflects South Korean demand. Moderate readings between +1% and +3% suggest healthy activity, while levels above +5% historically align with overheated speculation and short-term tops.
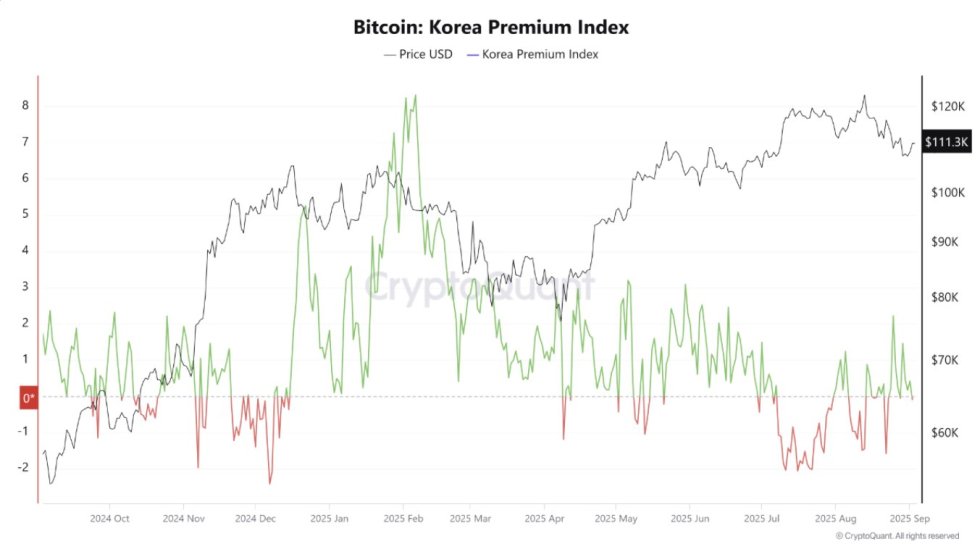
Overlaying these two regional metrics creates a clear picture: Asia often sparks the move, but the US decides whether it has staying power. When CPI and KPI align positively, rallies become synchronized, igniting global demand. However, when US institutions take profits while Asian traders keep buying, volatility spikes.
The takeaway is clear—today’s Bitcoin is no longer driven solely by whales but by regional liquidity corridors. Asia lights the spark, and the US transforms it into a lasting trend. For a Q4 rally, the critical trigger will be a decisive positive shift in CPI, combined with Asia’s continued ability to absorb supply. This alignment could mark Bitcoin’s next major leg higher.
Price Action Details: Technical Levels To Hold
Bitcoin’s 8-hour chart highlights a cautious consolidation phase as BTC trades around $110,918, attempting to stabilize after recent downside pressure. The price action has repeatedly tested the $110K zone, a key psychological and structural support level, while showing difficulties reclaiming momentum toward higher resistance areas.
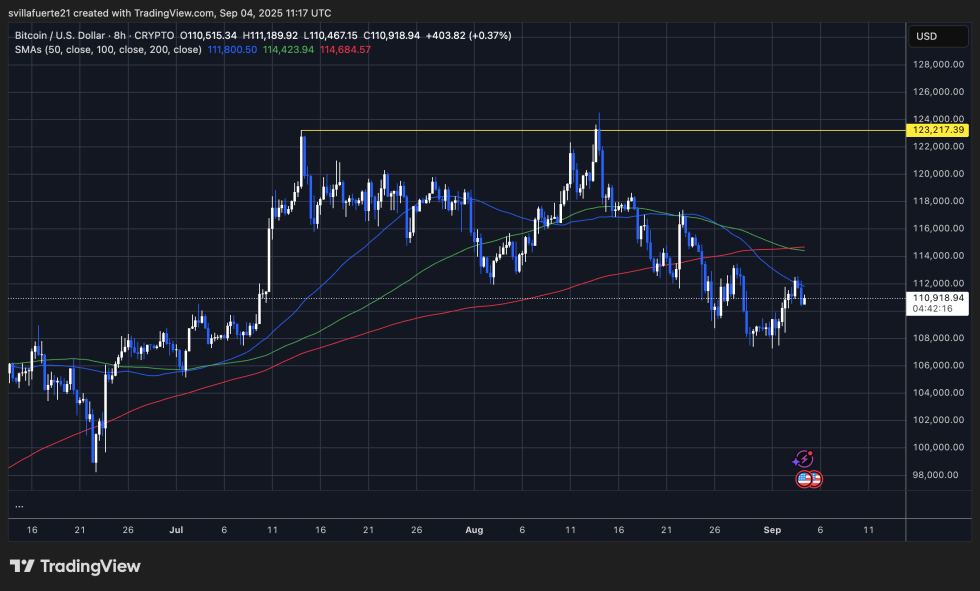
The chart shows that BTC remains under the 50-day and 100-day moving averages, with the 200-day SMA near $114,600 acting as overhead resistance. This technical setup suggests that while short-term relief rallies are possible, the broader structure leans toward corrective price action unless bulls manage a strong breakout above $113K–$115K.
Importantly, the market’s rejection from the $123,200 all-time high continues to weigh on sentiment. Lower highs and consistent resistance against moving averages indicate that BTC is still vulnerable to further downside tests, particularly if it fails to defend the $110K–$108K area. A break below this range could accelerate a move toward the $105K region, where the next cluster of demand sits.
On the other hand, holding above $110K and reclaiming $113K would suggest renewed buying interest and could open the door for another attempt to challenge $118K in the short term. For now, Bitcoin remains in consolidation, with traders closely monitoring whether bulls can defend this critical zone.
Featured image from Dall-E, chart from TradingView