The Crypto Market Cap fell sharply last week and now trades slightly above an important horizontal support area.
The crypto total market capitalization trades inside a horizontal support area. While the price action does not give any bullish signs, the RSI suggests a 50% increase could occur.
Total Market Capitalization Falls After Creating Lower High
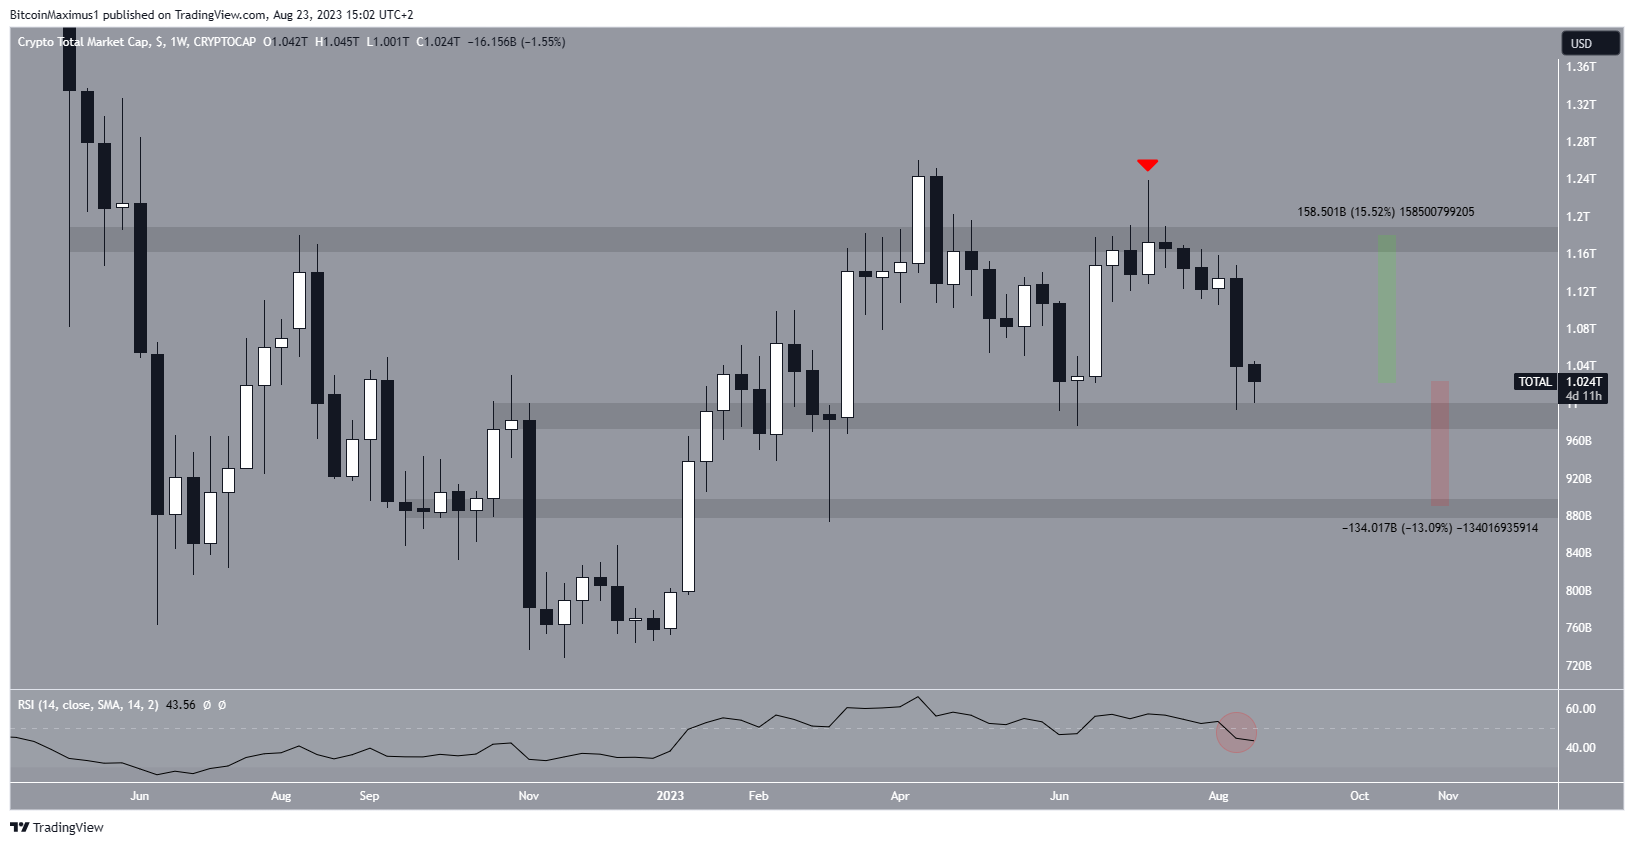
The TOTALCAP has decreased since July, when it reached a high of $1.24 trillion. At the time, the price seemed to break out from the $1.18 trillion resistance area.
However, instead of breaking out, total market capitalization created a long upper wick (red icon) and has fallen since. Last week, it reached a low of $992 billion.
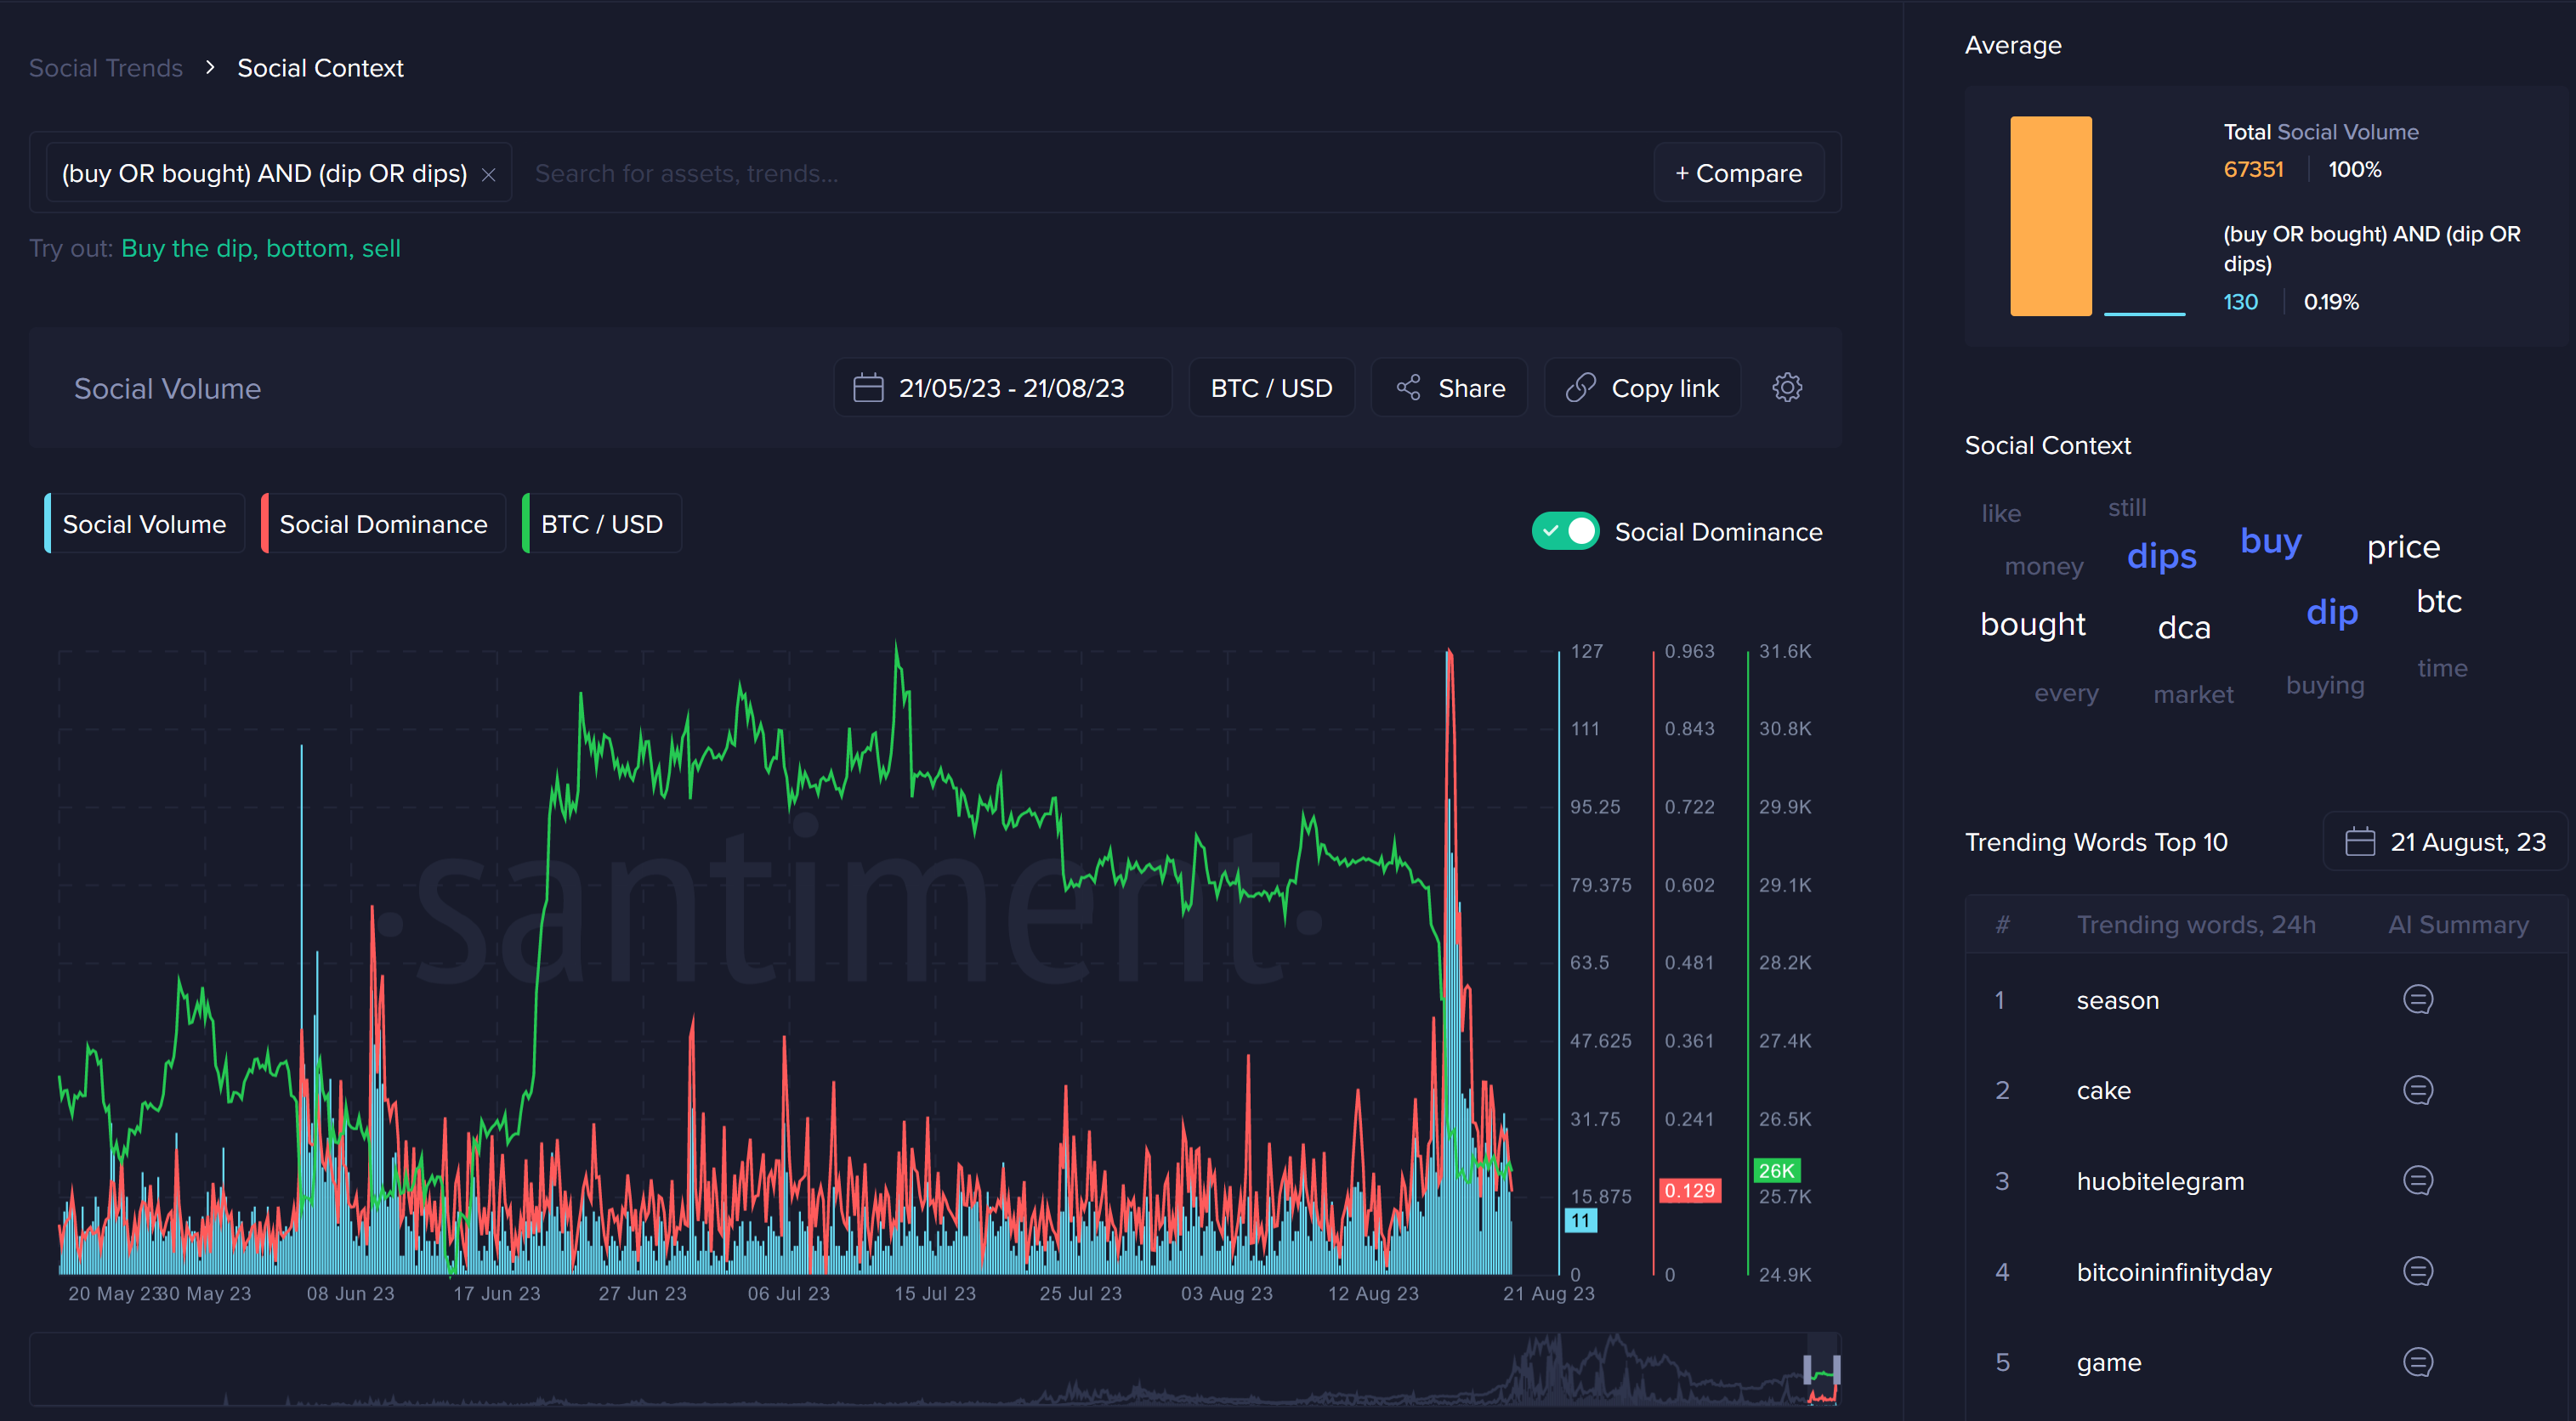
During the decrease, there was a considerable increase in “buy the dip” mentions on various social media platforms such as Reddit and Twitter.
The weekly RSI is bearish. When evaluating market conditions, traders use the RSI as a momentum indicator to determine if a market is overbought or oversold and to decide whether to accumulate or sell an asset.
If the RSI reading is above 50 and the trend is upward, bulls still have an advantage, but if the reading is below 50, the opposite is true. The indicator just decreased below 50 (red circle) and is falling, both signs of a bearish trend.

However, total market capitalization still trades above the $1 trillion horizontal support area. As long as it does not close below it, the possibility of a 15% bounce back to $1.18 trillion still remains. However, in case of a close below $1 trillion, a 13% drop to $890 billion will be likely.
Read More: 9 Best AI Crypto Trading Bots to Maximize Your Profits
Will Crypto Total Market Capitalization Recover Because of RSI?
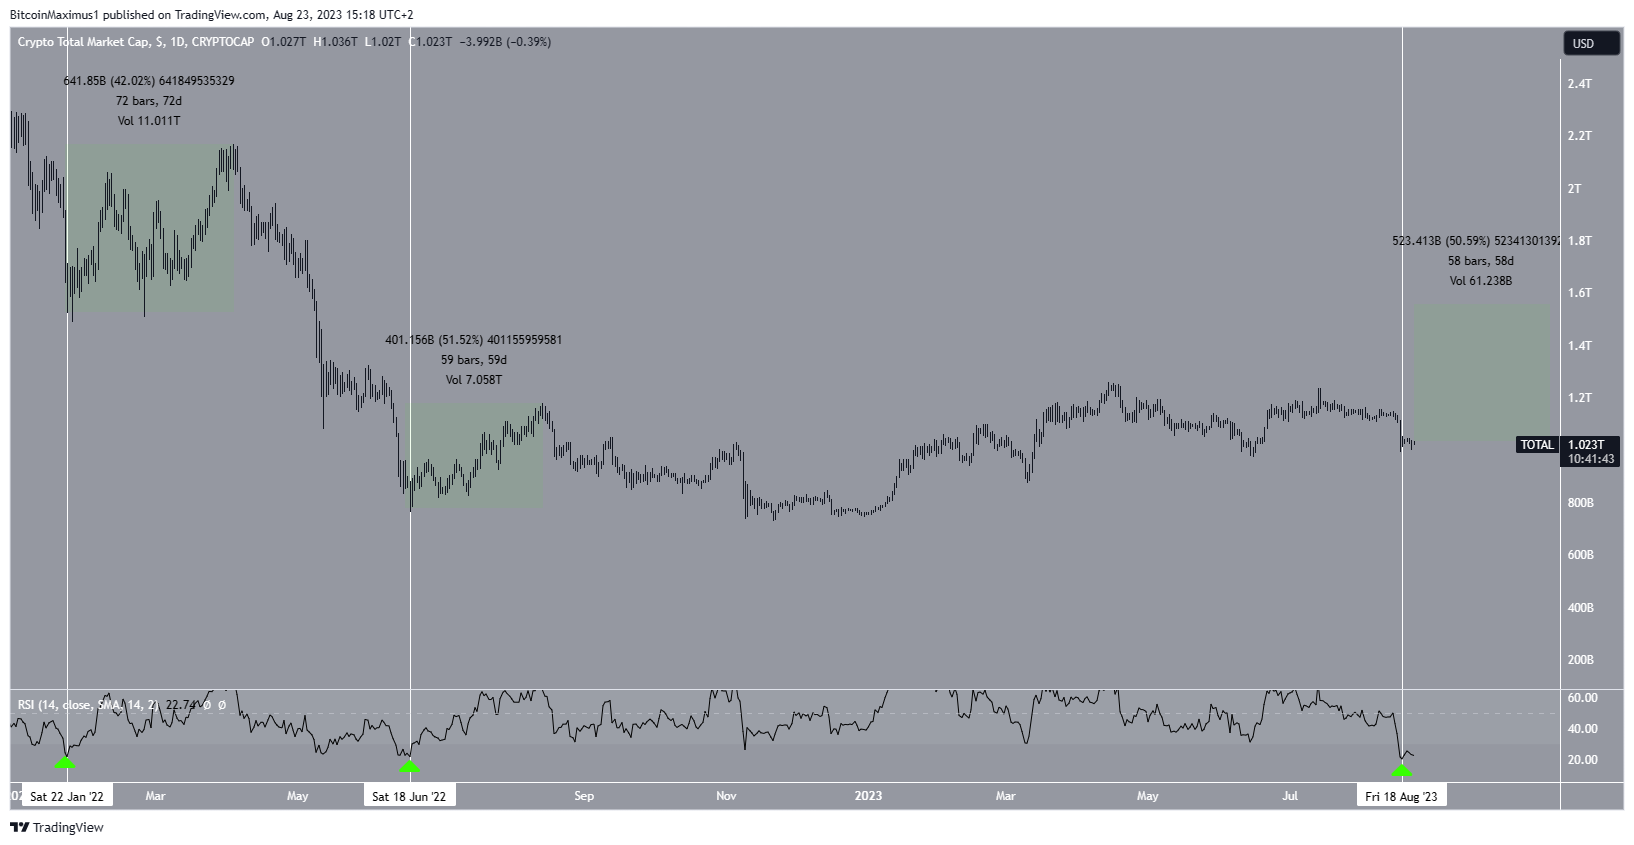
There is an interesting development when looking at the daily timeframe technical analysis coming from the RSI. The indicator has fallen into oversold territory (green icons) for the third time this year.
The two previous times led to 40 and 50% increases, respectively. Therefore, if a similar increase follows, it can catalyze a total market capitalization recovery of 50% in the next two months.

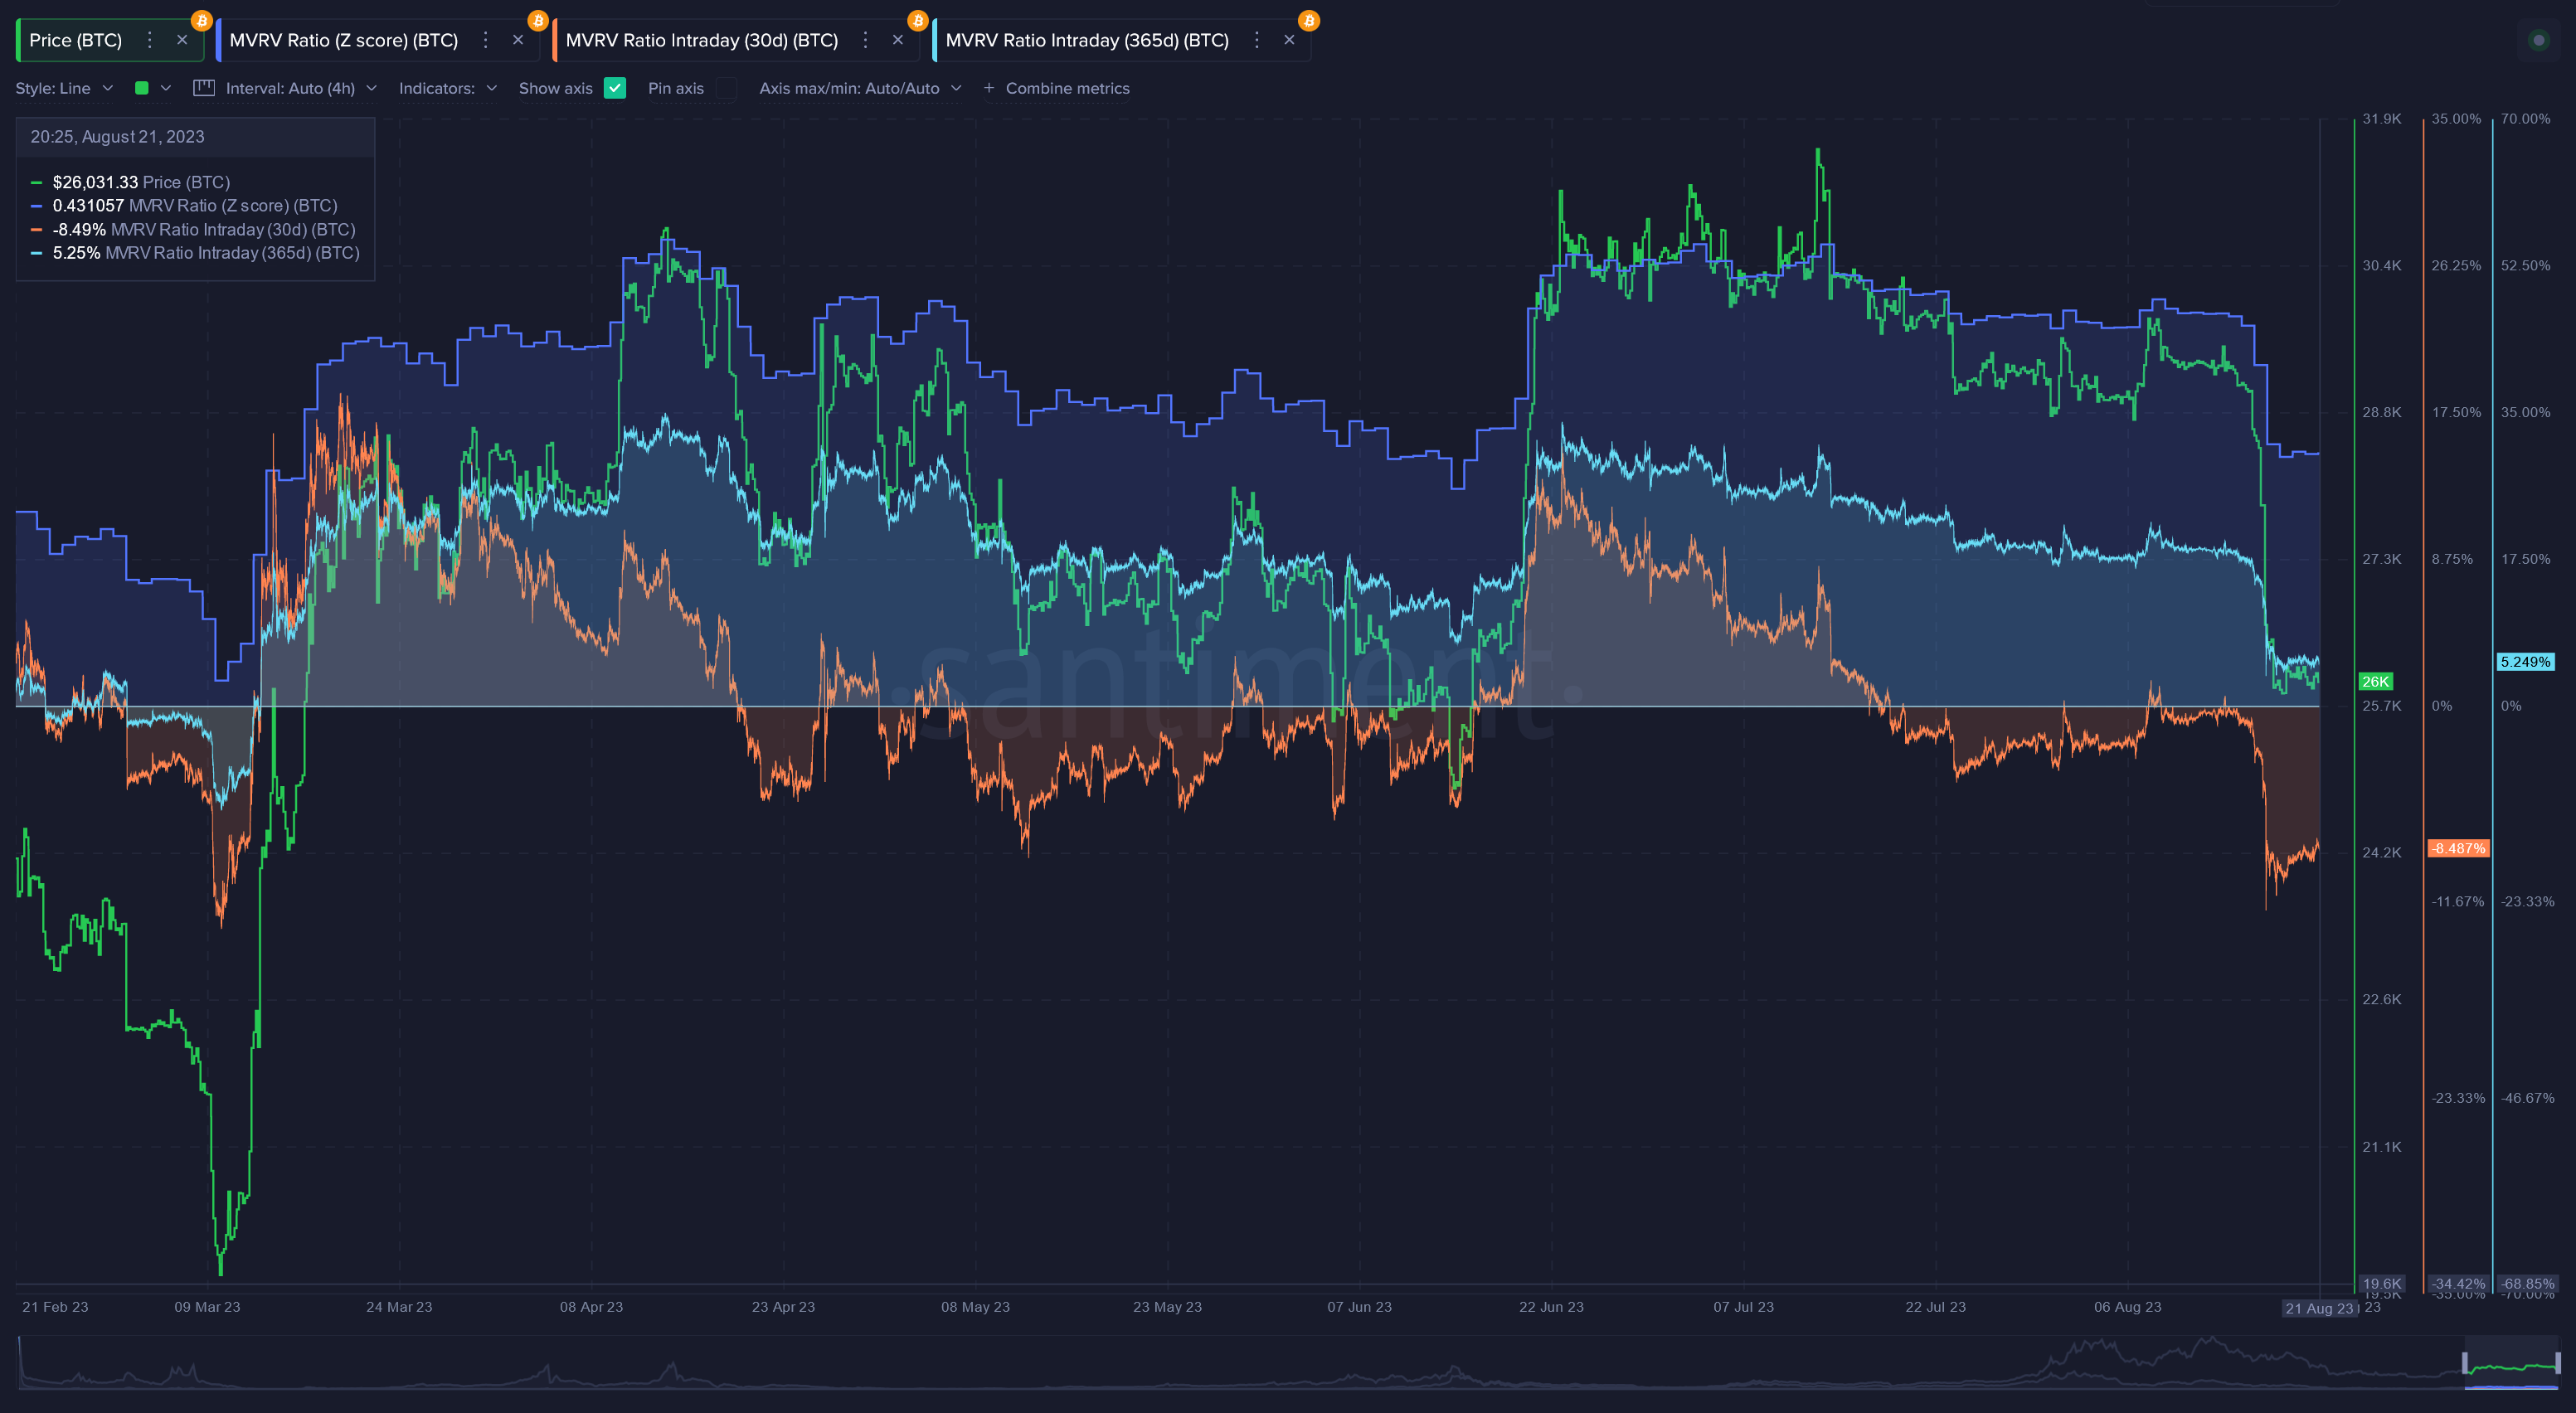
This is also visible when looking at the MVRV indicator and net losses for Bitcoin, which shows that traders are at the biggest loss since March 2023.
This is especially evident in short- and medium-term holders. This reading suggests that it is relatively safe to enter the market since most losses have already been realized.

To conclude, the total market capitalization trend can be considered bullish as long as a weekly close below $1 trillion does not occur. If it does, a decrease of 13% can occur.
Read More: Best Upcoming Airdrops in 2023
For BeInCrypto’s latest crypto market analysis, click here
The post This Crypto Total Market Capitalization Signal Precedes 50% Gains – Is $1.5T in Sight? appeared first on BeInCrypto.
