The Ethereum (ETH) price broke out from long-term horizontal and diagonal resistance levels.
The weekly RSI is giving a signal that preceded a parabolic ETH increase in the previous market cycle.
Will Ethereum Accelerate Increase?
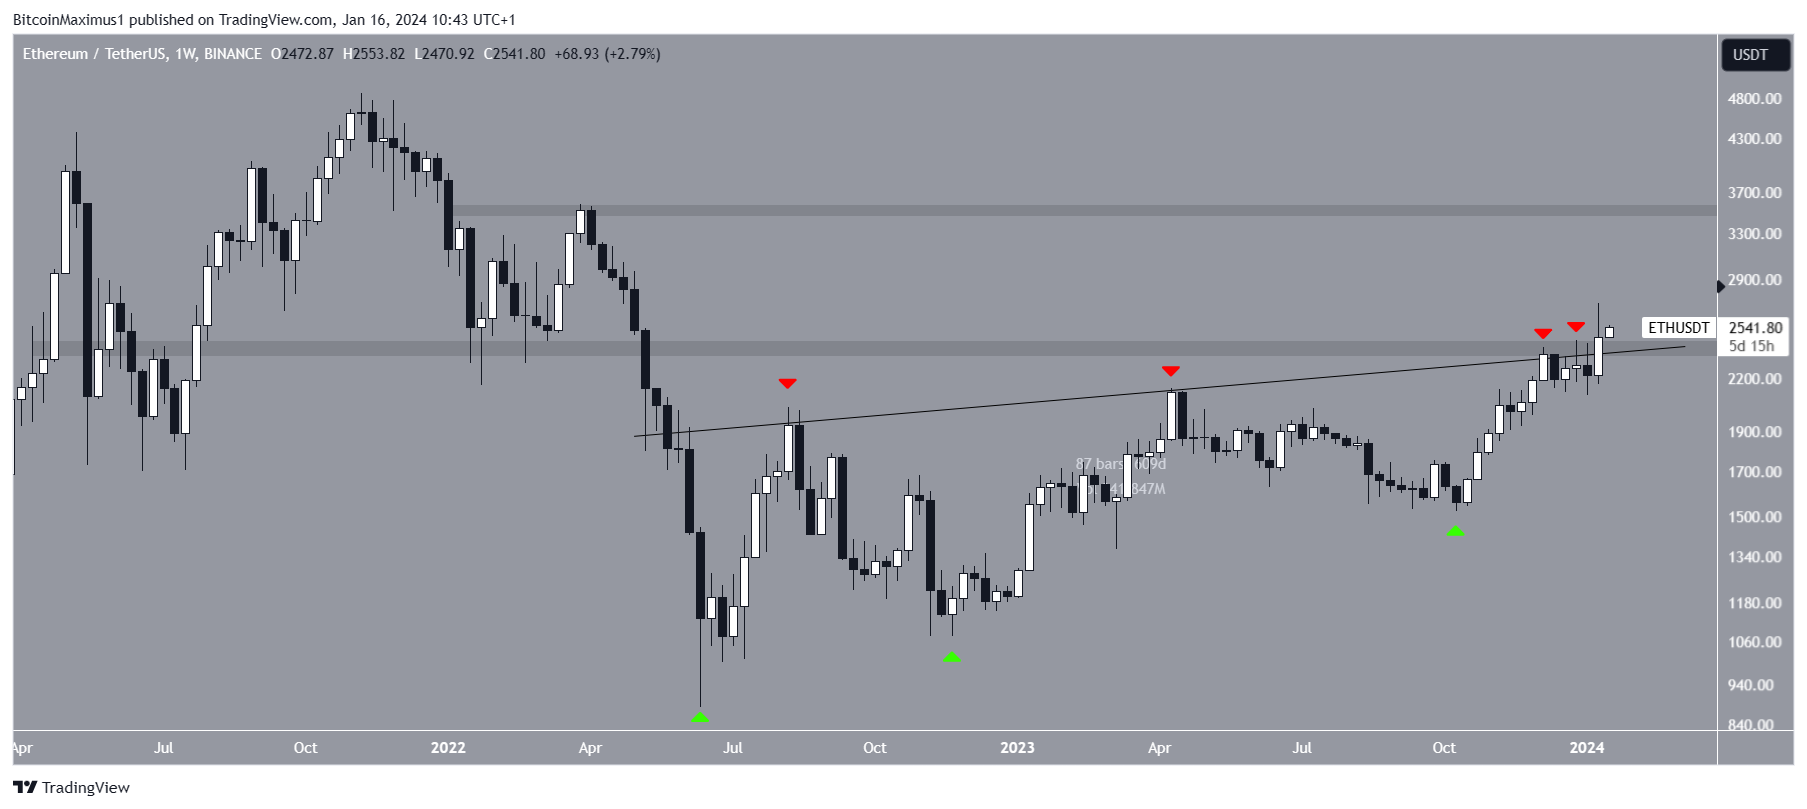
The ETH price has increased gradually since falling to a low of $880 in June 2022. The upward movement was constrained by an ascending resistance trend line, which caused four rejections (red icons). The most recent occurred in December 2023.
ETH also created higher lows during the upward movement, accelerating the increase every time ETH bounced (green icons). The most recent bounce occurred in October.
After more than 600 days, the ETH price finally broke out from the ascending resistance trend line last week.
The breakout was consequential since it took ETH above a long-term horizontal resistance area. Previously, the area had intermittently acted as both support and resistance since April 2023.
Read More: Ethereum Merge: Everything You Need To Know
What do Analysts Say?
Cryptocurrency traders and analysts on X have an overwhelmingly positive view of ETH.
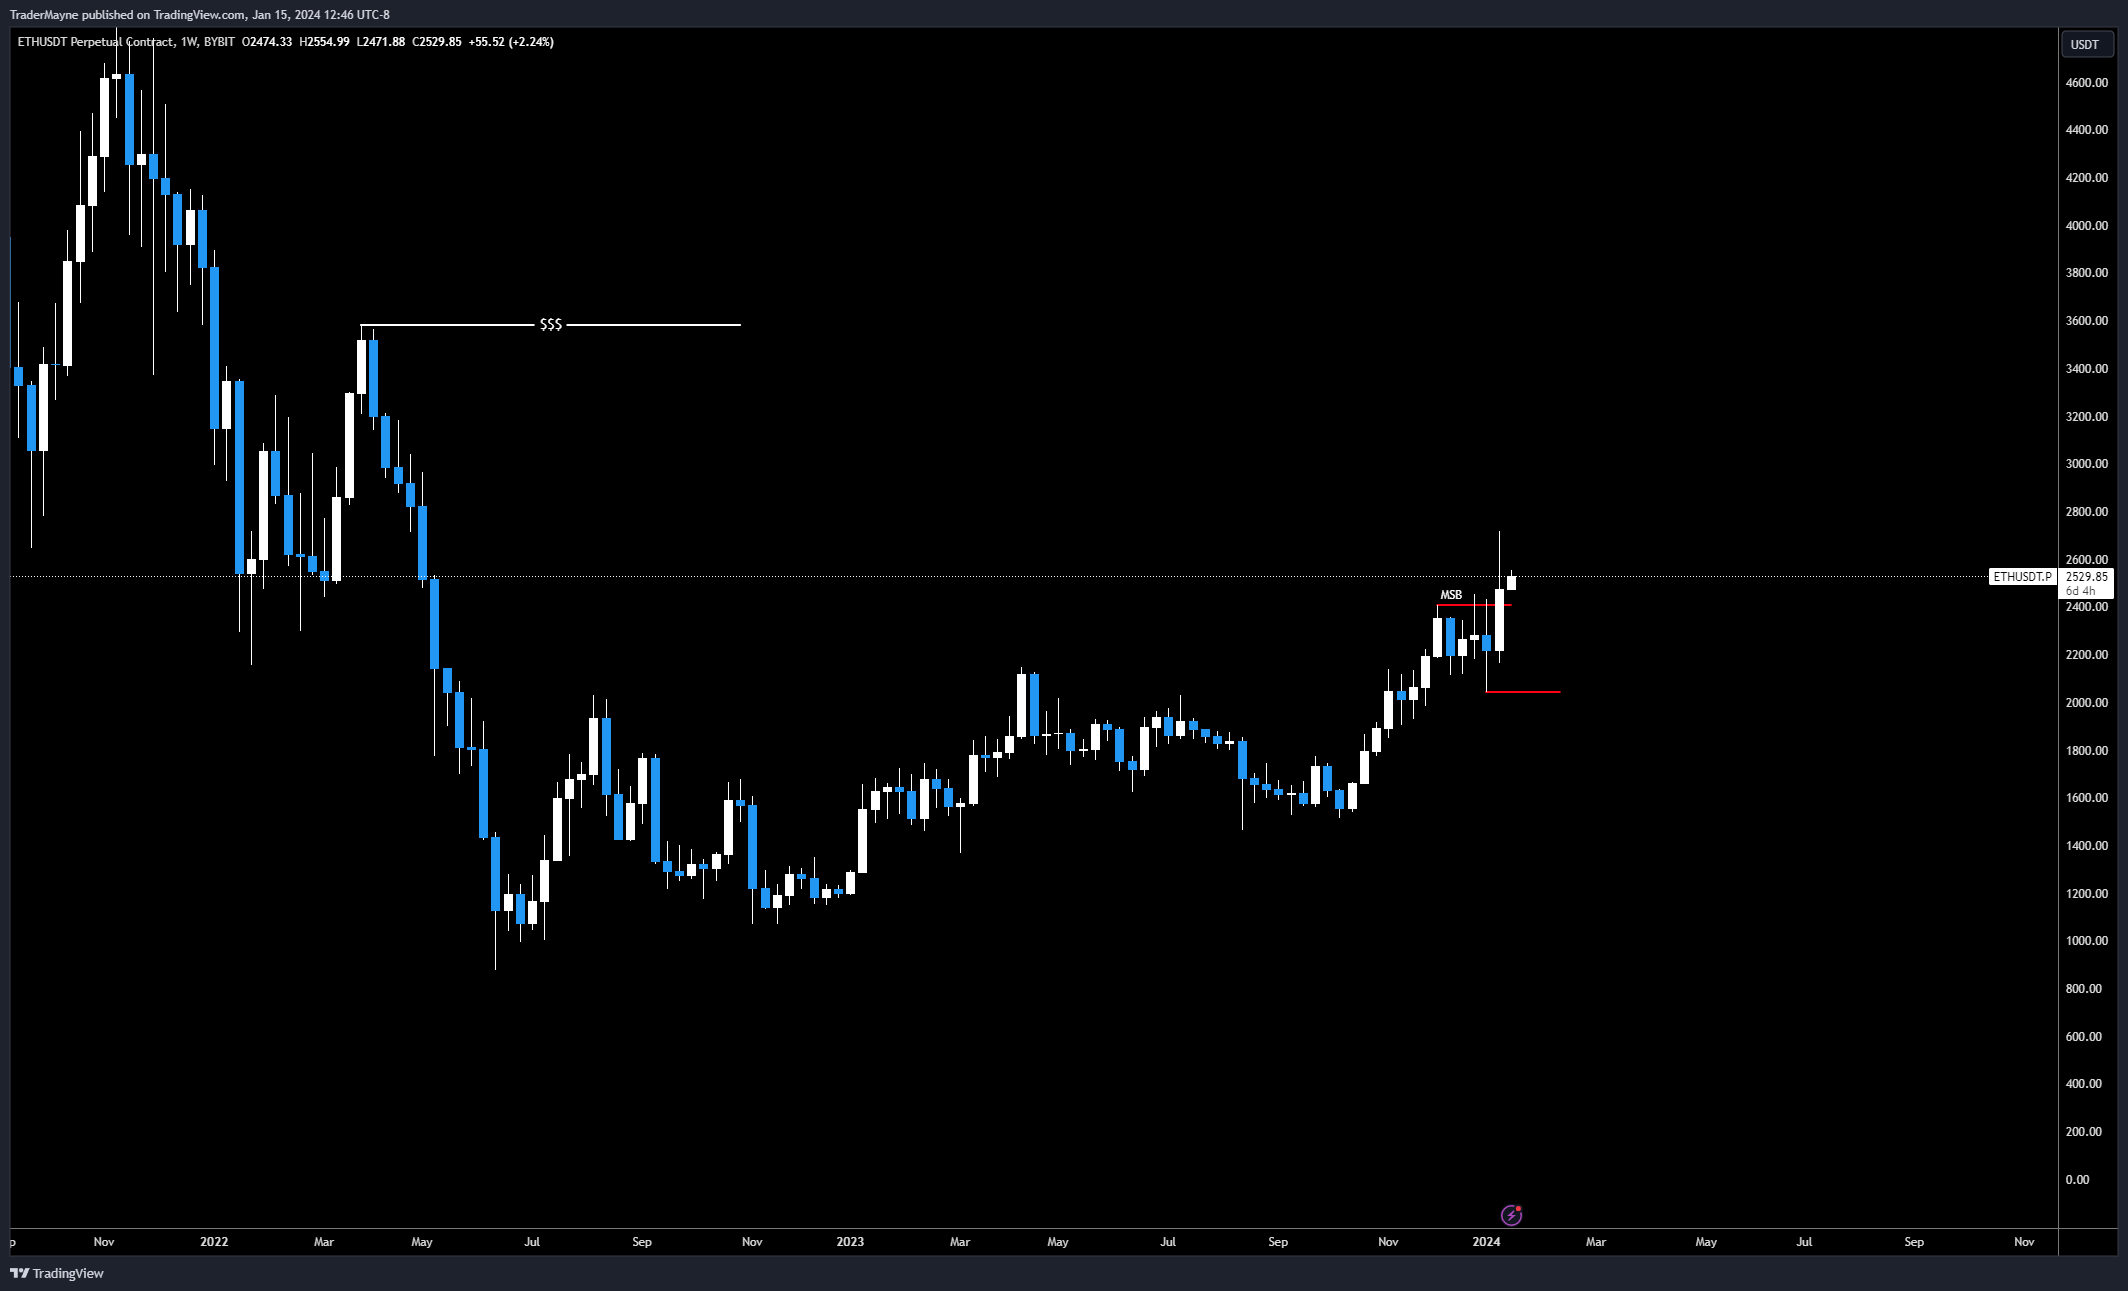
Trader Mayne leads the charge, tweeting:
I’m still fully allocated to spot ETH and ETH betas. I believe $3400 remains the target, invalidation would be a weekly close below $2044.

Cold Blood shill suggests that the ETH price will soon move above $3,000, while CJ believes a sweep of the lows will occur tomorrow, after which the ETH price will move upwards.
Finally, Bluntz Capital predicts that ETH will outperform Bitcoin. He expects a price of ₿0.01 for ETH/BTC in 2024, a level not reached since 2018.
Read More: What is the Ethereum Shanghai Upgrade?
ETH Price Prediction: Will 2020 Fractal Lead to Parabolic Increase?
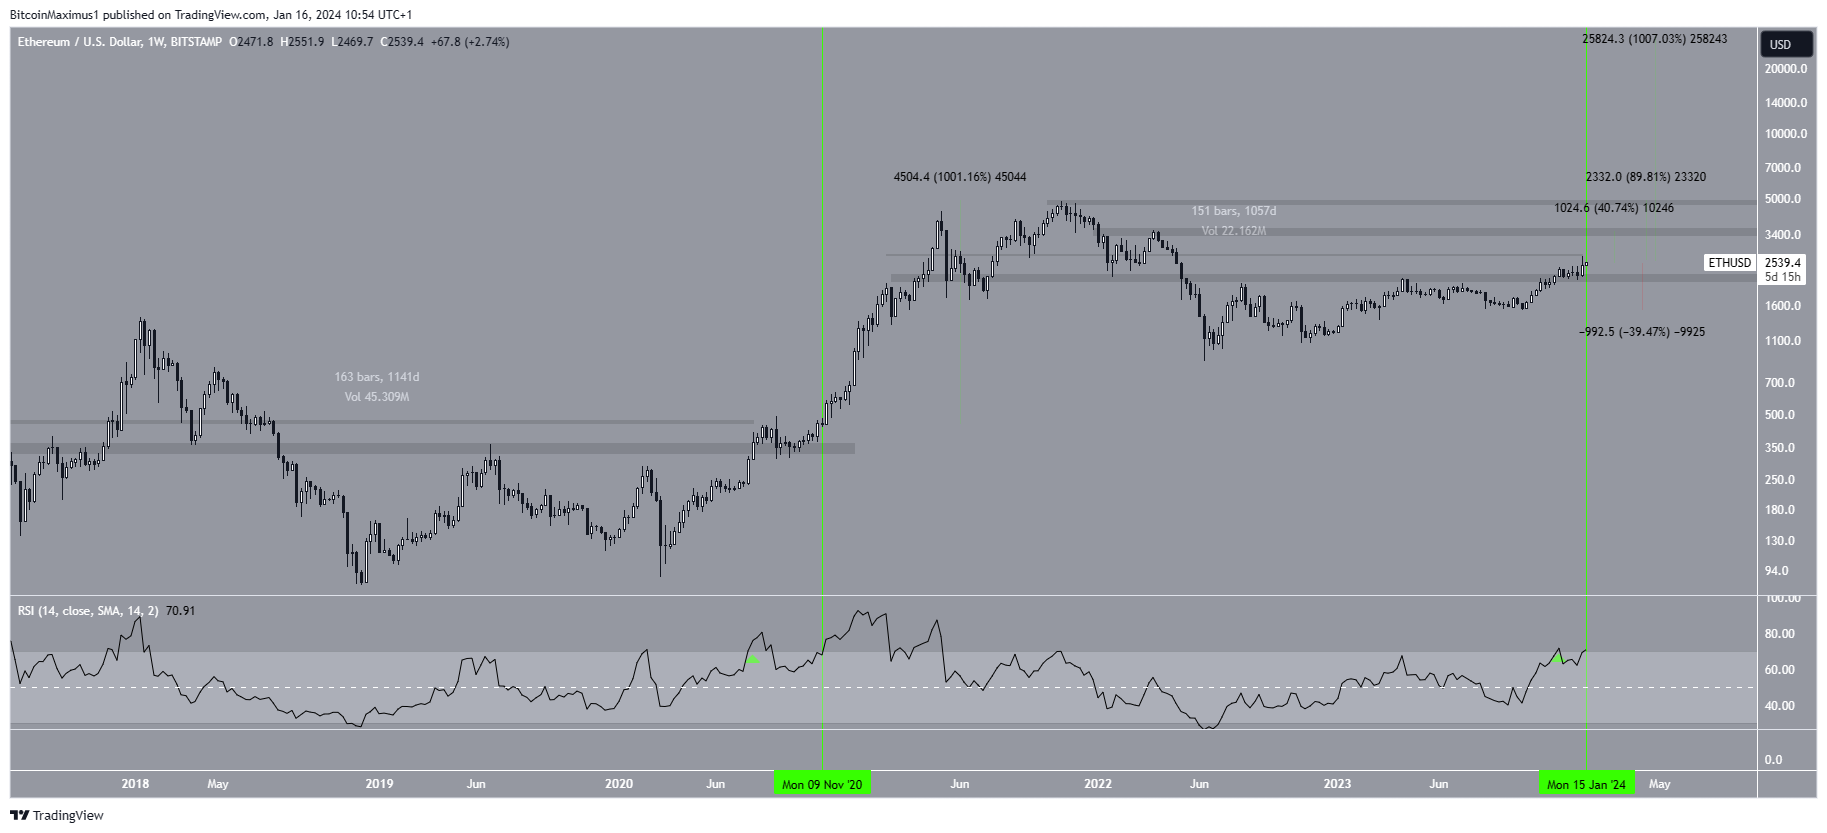
An interesting realization comes from comparing the Ethereum price movement in the previous bull cycle to the current one.
In 2020, Ethereum broke out from a horizontal resistance area that, had at times, provided support and resistance for more than 1,000 days. This is very similar to the current breakout.
Also, the RSI readings are almost identical. Market traders use the RSI as a momentum indicator to identify overbought or oversold conditions and to decide whether to accumulate or sell an asset.
Readings above 50 and an upward trend indicate that bulls still have an advantage, whereas readings below 50 suggest the opposite.
In 2020, the RSI moved into overbought territory (green icon) and then fell below. The second movement into overbought territory (green vertical trend line) gave a signal that catalyzed a parabolic ETH upward movement of 1,000%, leading to the all-time high.
A 1,000% increase would take the ETH price to $27,000 this cycle. For the short-term, more reasonable targets are at $3,500 and $5,000, 40 and 90% above the current price.

Despite this bullish ETH price prediction, closing below $2,200 will invalidate this bullish prediction. Then, the price could fall by 40% to $1,600.
Read More: How to Buy Ethereum (ETH) and Everything You Need to Know
For BeInCrypto‘s latest crypto market analysis, click here.
![]()
Coinbase
Coinbase” target=”_blank”>Explore →
![]()
iTrustCapital
iTrustCapital” target=”_blank”>Explore →
![]()
Metamask Portfolio
Metamask Portfolio” target=”_blank”> Explore →
![]()
UpHold
UpHold” target=”_blank”>Explore →
![]()
eToro
eToro” target=”_blank”>Explore →
![]()
BYDFi
BYDFi” target=”_blank”>Explore →
Explore more
The post This Ethereum (ETH) Signal Led to a 1,000% Increase in 2020 – Will History Repeat? appeared first on BeInCrypto.
