
The Crypto Market Cap (TOTALCAP) and Bitcoin (BTC) resumed their decrease last week. SEI created a bearish double-top pattern.
In the news today:
TOTALCAP Falls Below Support
The weekly time frame chart shows that the cryptocurrency market cap has fallen since reaching a high of $1.80 trillion at the start of January.
The decrease caused two long upper wicks (red icons), considered signs of selling pressure. TOTALCAP also failed to sustain the upward movement above the $1.61 trillion resistance area, which a horizontal and Fib resistance level.
If TOTALCAP continues to fall, it can decrease by another 12% to the closest support at $1.40 trillion.

Sponsored
Despite this bearish TOTALCAP prediction, reclaiming the $1.61 trillion area and the channel’s support trend line can trigger a 35% increase to the next resistance at $2.10 trillion.
Read More: Where to Trade Bitcoin Futures
Bitcoin Fails Reclaim Attempt
The Bitcoin price had traded inside an ascending parallel channel since December. However, it broke down from the channel on January 12, 2024. This is a sign that the upward movement has ended.
After a rejection from the channel’s support trend line on January 16, BTC resumed its downward movement, falling to a low of $40,258 on January 19.
If the decrease continues, BTC can fall 9% to the closest support area at $37,600.
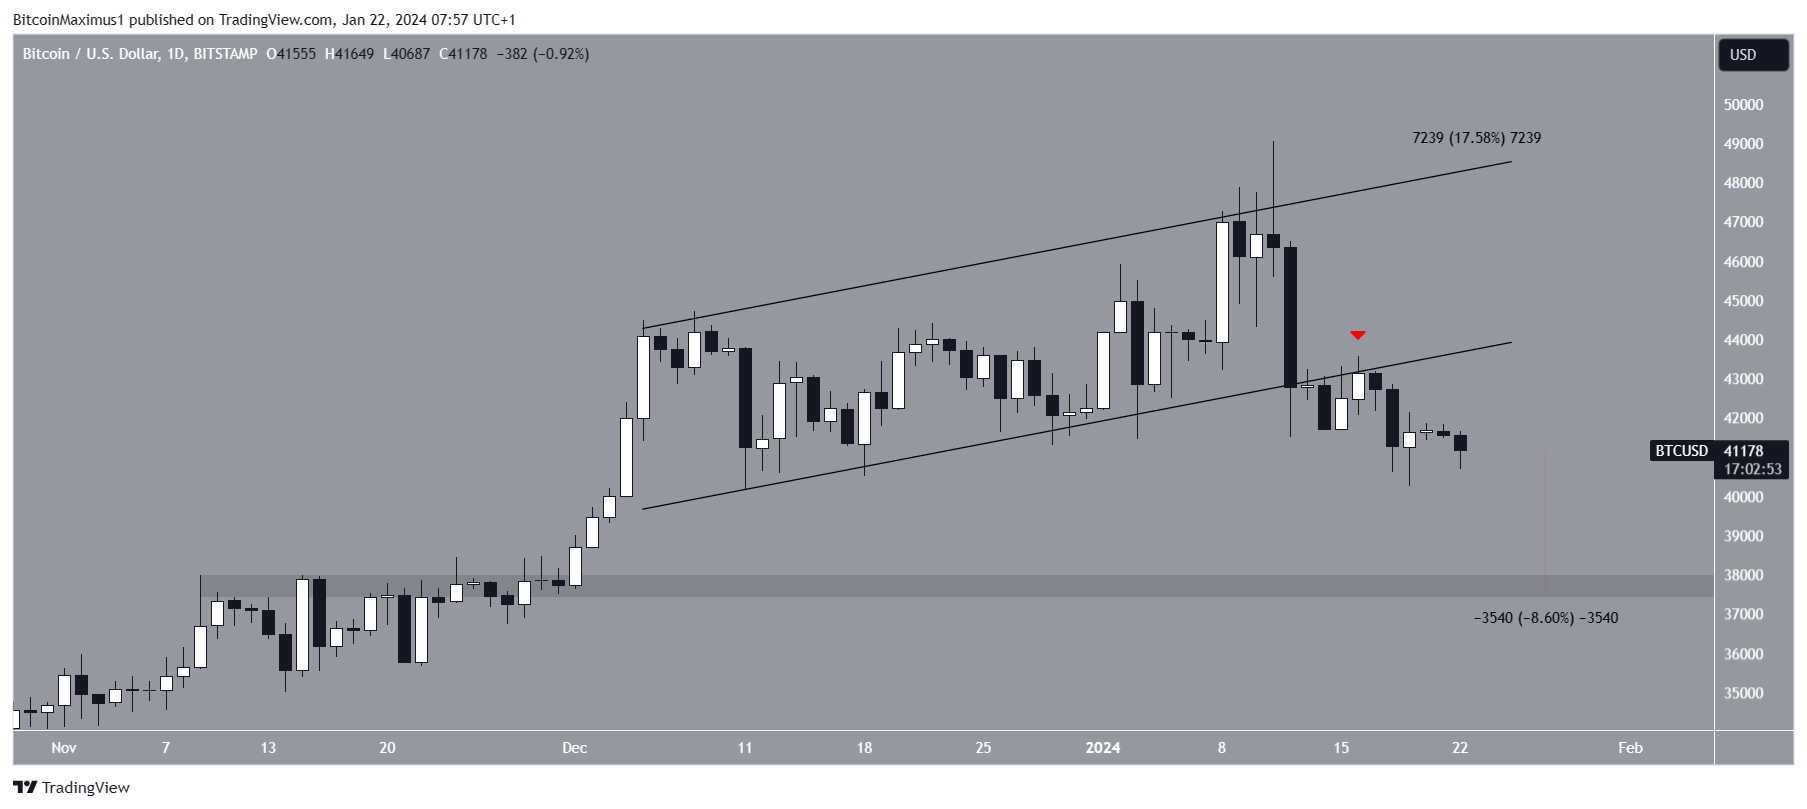
Despite this bearish BTC price prediction, reclaiming the channel’s support trend line will result in a reversal. Then, BTC can increase by nearly 18% to the channel’s resistance trend line at $48,550.
Read More: What is a Bitcoin (BTC) ETF?
SEI Creates Double Top
The SEI price reached an all-time high of $0.88 on January 1. After a brief drop, the price increased again and made another breakout attempt on January 17.
The ensuing fall created a double top, considered a bearish pattern (red icons). SEI has fallen since the double top, culminating with a low of $0.61 today.
Currently, SEI trades inside the $0.63 Fib support area. It can fall 23% to the closest support at $0.47 if it breaks down.
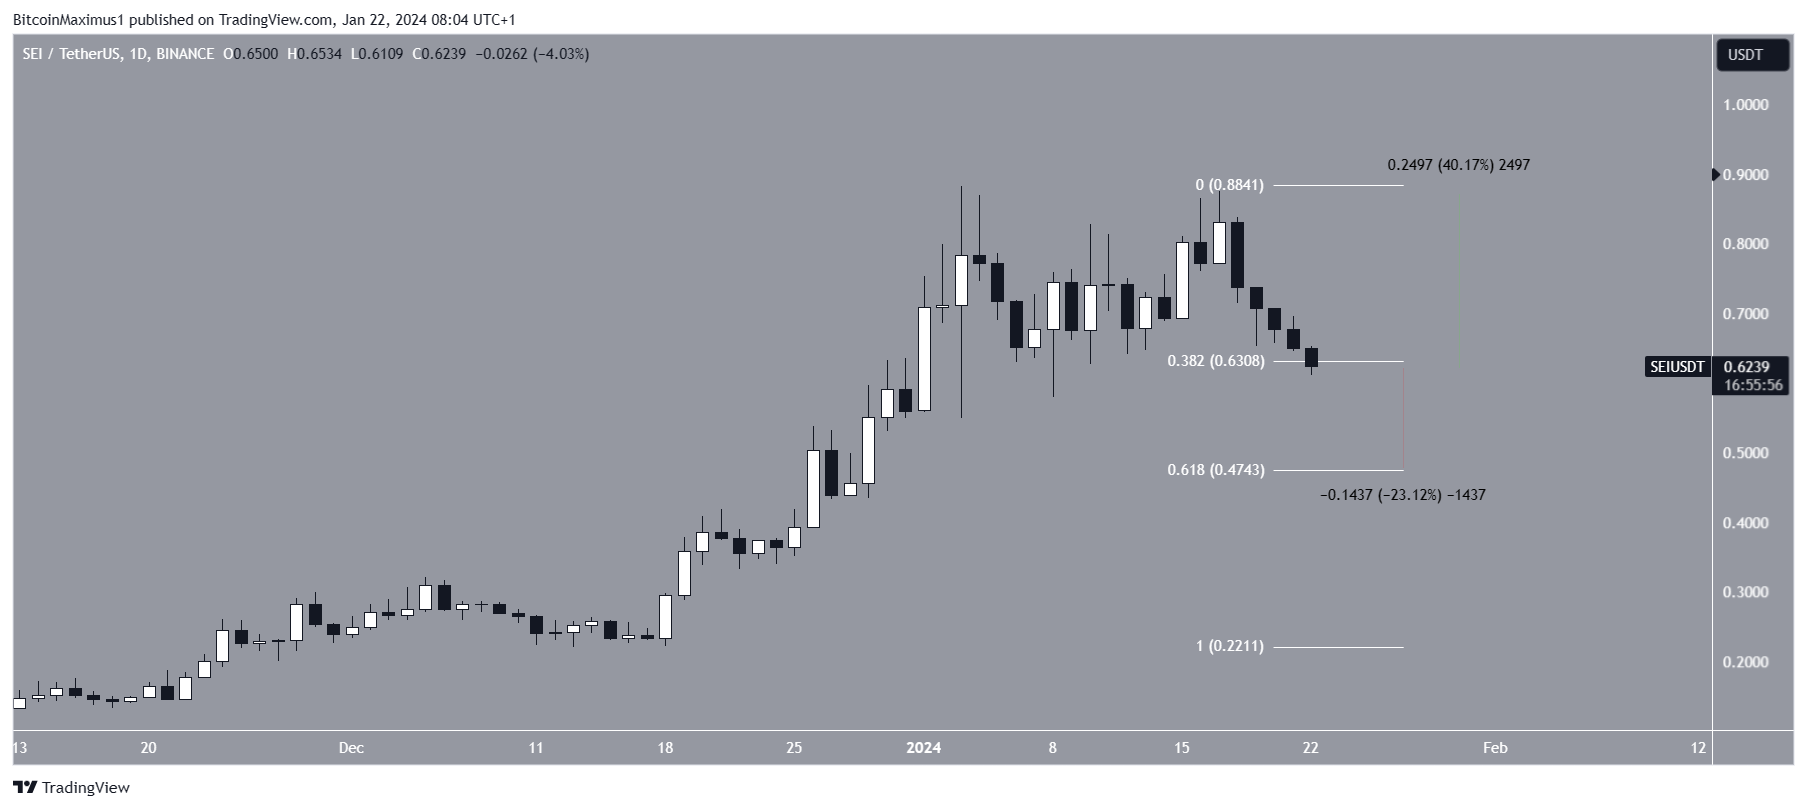
Despite this bearish SEI price prediction, a strong bounce from the current support can trigger a 40% increase to an all-time high of $0.88.
Read More: 13 Best Altcoins to Invest in January 2024
For BeInCrypto‘s latest crypto market analysis, click here.
Sponsored
Disclaimer
In line with the Trust Project guidelines, this price analysis article is for informational purposes only and should not be considered financial or investment advice. BeInCrypto is committed to accurate, unbiased reporting, but market conditions are subject to change without notice. Always conduct your own research and consult with a professional before making any financial decisions. Please note that our Terms and Conditions, Privacy Policy, and Disclaimers have been updated.