
The crypto market cap (TOTALCAP) and the Bitcoin (BTC) price have generated bullish divergences but show bearish price action. THORChain (RUNE) is trading above an important horizontal support area.
The bankrupt crypto lender Genesis Global Capital (GGC) has launched a lawsuit against its parent company, Digital Currency Group (DCG) for not repaying roughly $630 million in loans.
Crypto Market Cap (TOTALCAP) Validates Resistance After Breakdown
TOTALCAP has fallen since its yearly high in April. The price created a slightly lower high in July before accelerating its rate of increase.
On August 17, TOTALCAP broke down from a long-term ascending support line that has been in place since the beginning of the year. Afterward, it validated it as resistance on August 29 (red icon). This is a common movement after breakdowns.
While the price action is bearish, the RSI shows bullish signs. With the RSI as a momentum indicator, traders can determine whether a market is overbought or oversold and decide whether to accumulate or sell an asset.
Bulls have an advantage if the RSI reading is above 50 and the trend is upward, but if the reading is below 50, the opposite is true. The indicator has generated a significant amount of bullish divergence (green circle), something that often precedes bullish trend reversals.
Secure your future with accurate crypto forecasts. Click here.
If the bullish divergence materializes, the price can increase by 9% and reach the ascending support line at $1.13 trillion. On the other hand, if TOTALCAP breaks down from the $1 trillion support, it can fall by another 8% and reach the 0.618 Fib retracement support level at $940 billion.
Bitcoin (BTC) Price Generates Bullish Divergence
The BTC price has fallen under a descending resistance line since July 13. The decrease led to a low of $25,166 on August 17. While the price bounced afterward, it failed to reach the descending resistance line. Moreover, it returned close to its lows at the beginning of September.
Similarly to the TOTALCAP, the price action is bearish. However, the daily RSI has also generated significant bullish divergence.
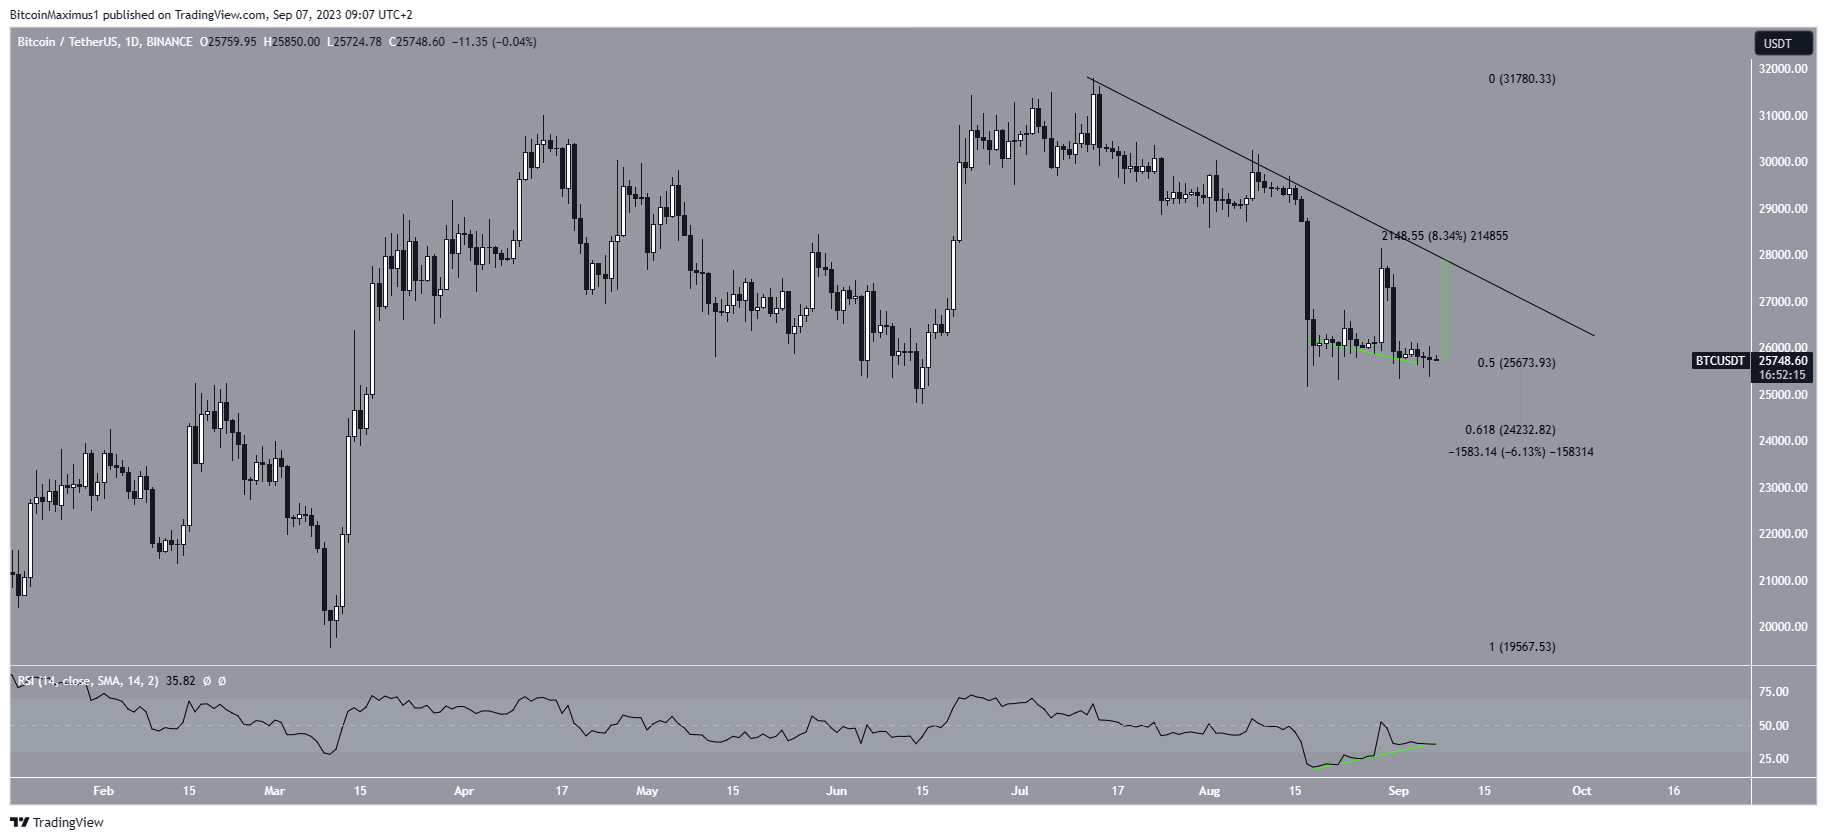
If the bullish divergence materializes and the price increases, BTC can reach the descending resistance line at $27,900. This would amount to an increase of 8% measured from the current price.
However, if the BTC price breaks down below $25,700, it can fall to the 0.618 Fib retracement support level at $24,200, a drop of 6% measuring from the current price.
THORChain (RUNE) Price Clears Horizontal Resistance
The RUNE price has increased since the beginning of August. The price broke out from the $1.45 horizontal area on August 15 and reached a new yearly high of $2.03 four days later. However, the price created a long upper wick and has fallen since. The decrease validated the $1.95 area as resistance.
Even though the price has fallen since RUNE is still trading above the $1.45 horizontal area.
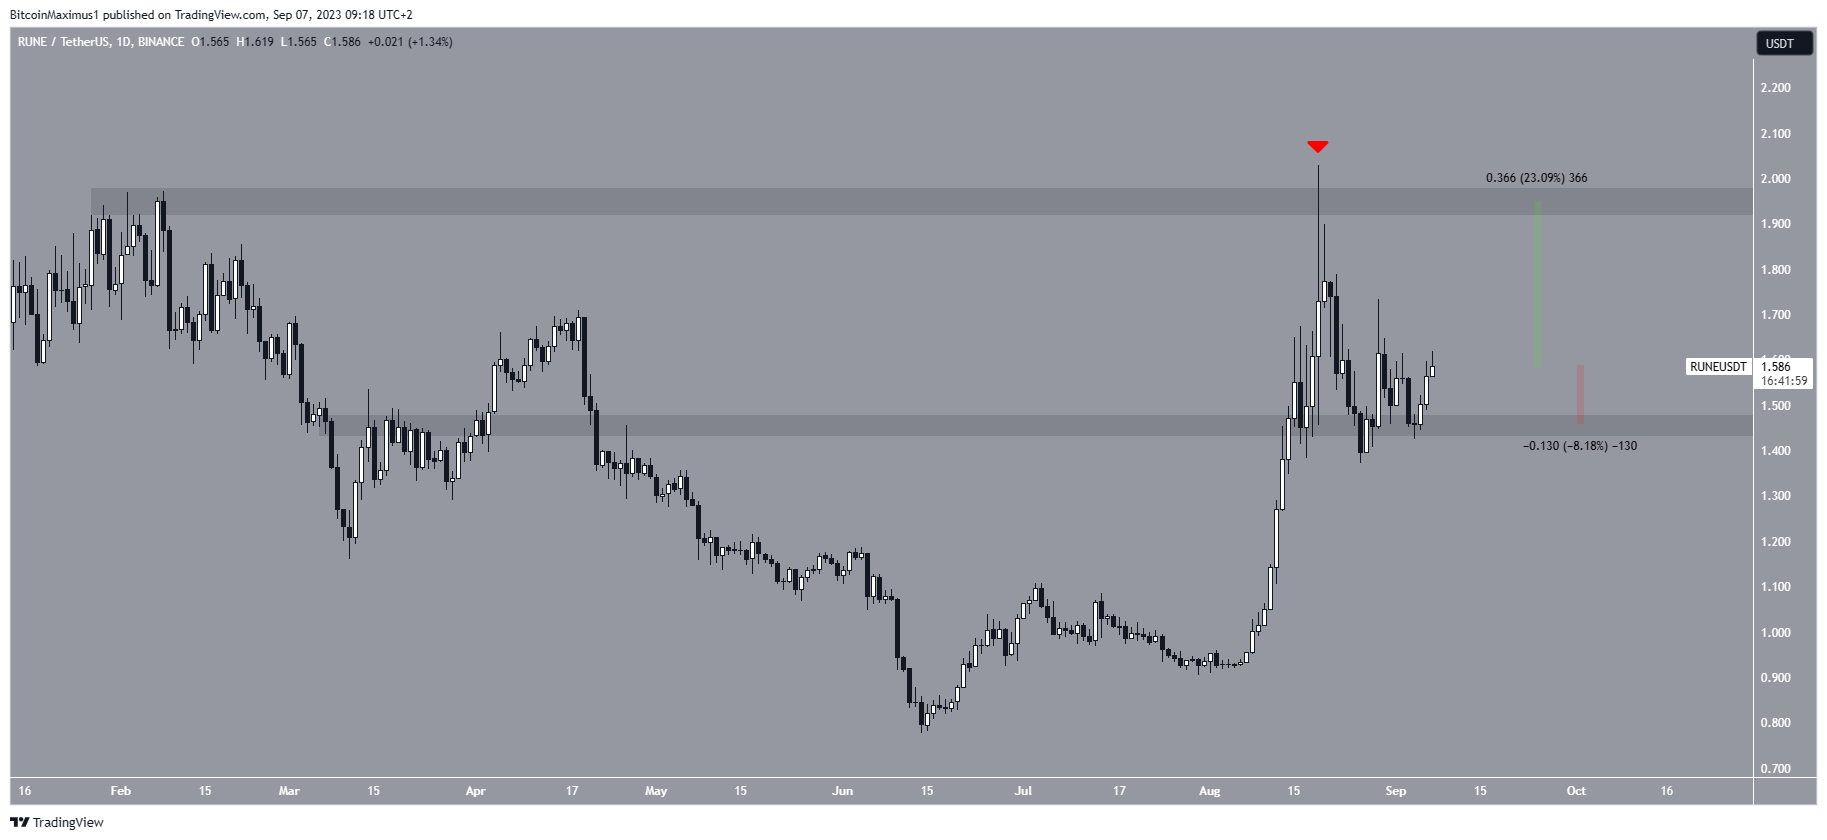
If the bounce continues, RUNE can increase by 23% and reach the $1.95 resistance area. However, if it loses momentum, RUNE could fall by 8% and reach the $1.45 horizontal support area again.
Read More: Top 9 Telegram Channels for Crypto Signals in 2023
For BeInCrypto’s latest crypto market analysis, click here.
The post Why Is the Crypto Market Up Today? appeared first on BeInCrypto.