The XRP price broke out from a long-term descending resistance trend line but traded under a short-term one.
Will the XRP price eventually break out, or will the trend line cause another rejection? Let’s find out!
XRP Trades Above Resistance
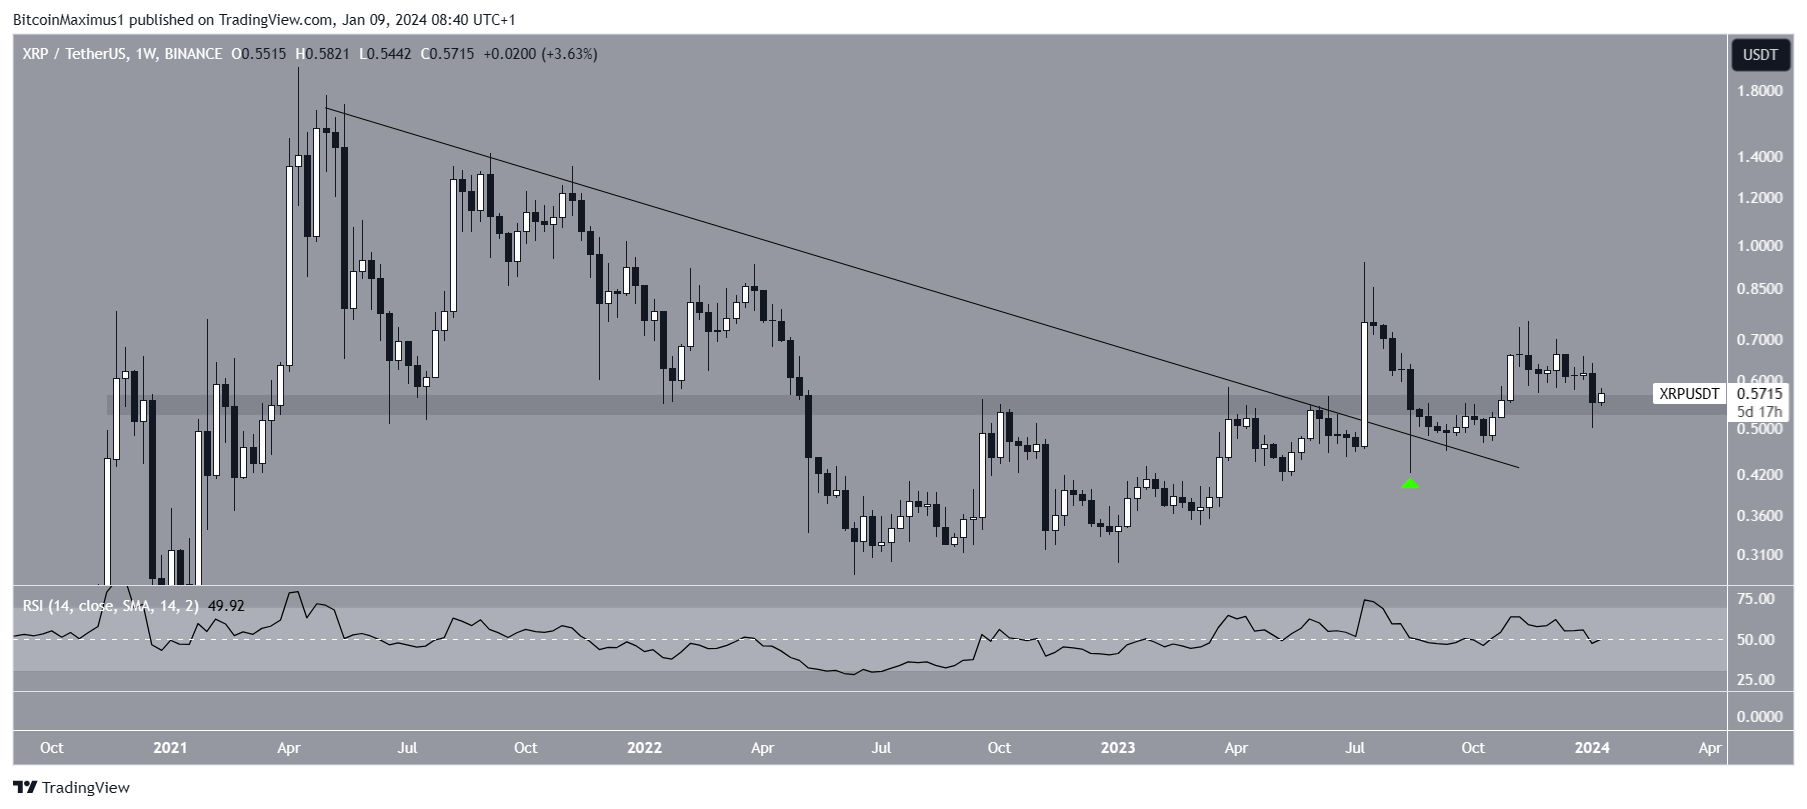
The XRP price has increased since falling to a low of $0.29 in June 2022. The price broke out from a long-term descending resistance trend line in July 2023, reaching a high of $0.94.
While XRP fell afterward, it validated the long-term resistance trend line as support (green icon) and has increased since.
The XRP price trades above a horizontal area, which has intermittently acted as support and resistance since 2021.
The RSI is a momentum indicator traders use to evaluate whether a market is overbought or oversold and whether to accumulate or sell an asset.
Readings above 50 and an upward trend suggest that bulls still have an advantage, while readings below 50 indicate the opposite. The weekly RSI is at 50, a sign of an undetermined trend.
Read More: How To Buy XRP and Everything You Need To Know
What Do the Analysts Say?
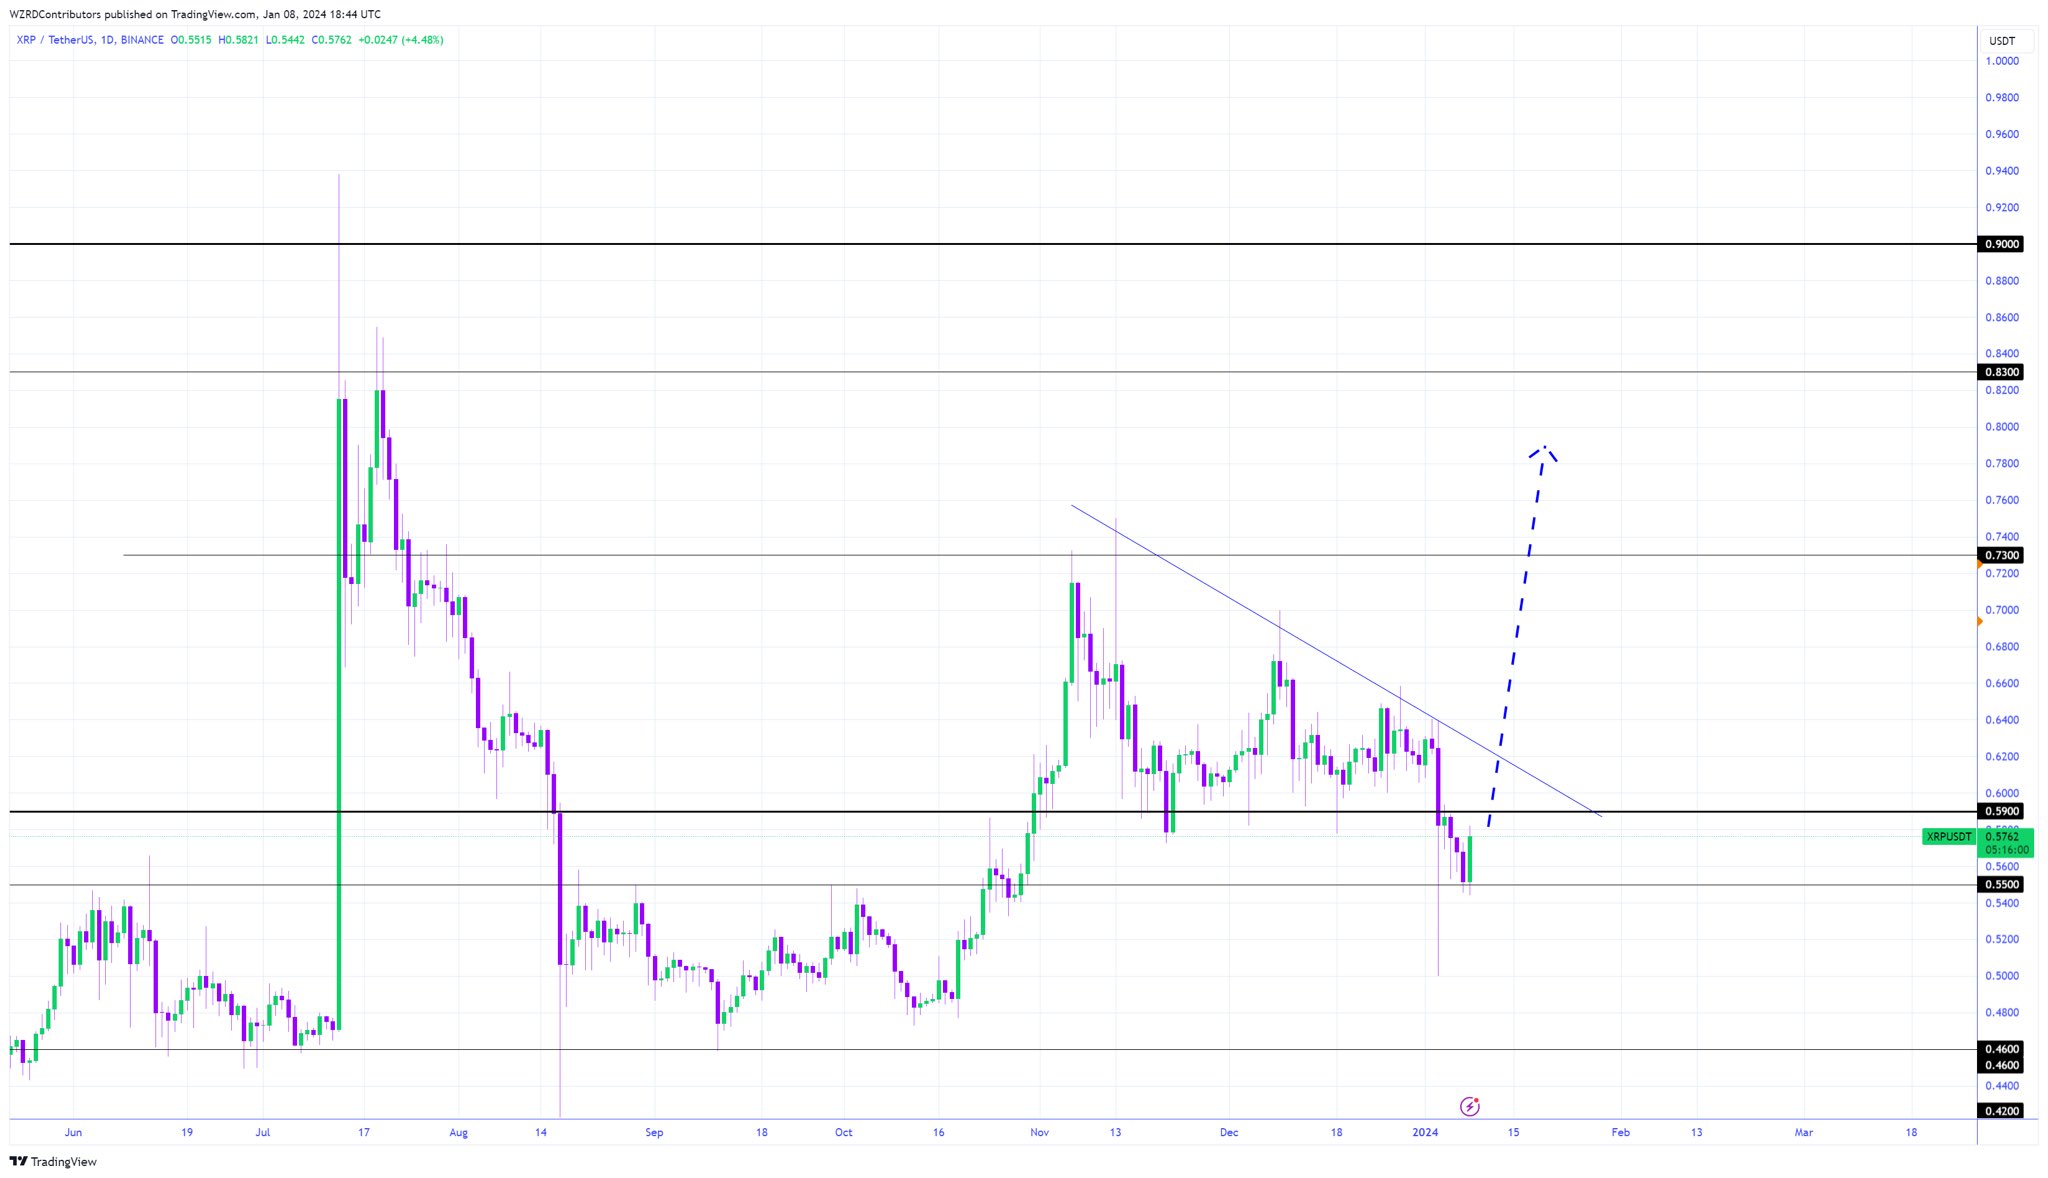
Cryptocurrency analysts and traders on X believe the XRP price will begin an uptrend. CryptoWZRD suggests a breakout from the descending resistance trend line will launch the price toward $0.75.

Cryptoes is also bullish, tweeting that:
Strong #XRP Bullish Engulfing daily candle
Price closed below $0.578 resistance level Need to see a close above that to revisit $0.60 Will Update $XRP
RealXRPwhale believes this was the final dip for XRP before the price moved higher. There are also rumors about a potential XRP ETF launched by Fidelity.
Read More: Getting Started With XRP Wallets
XRP Price Prediction: Breakout or Breakdown?
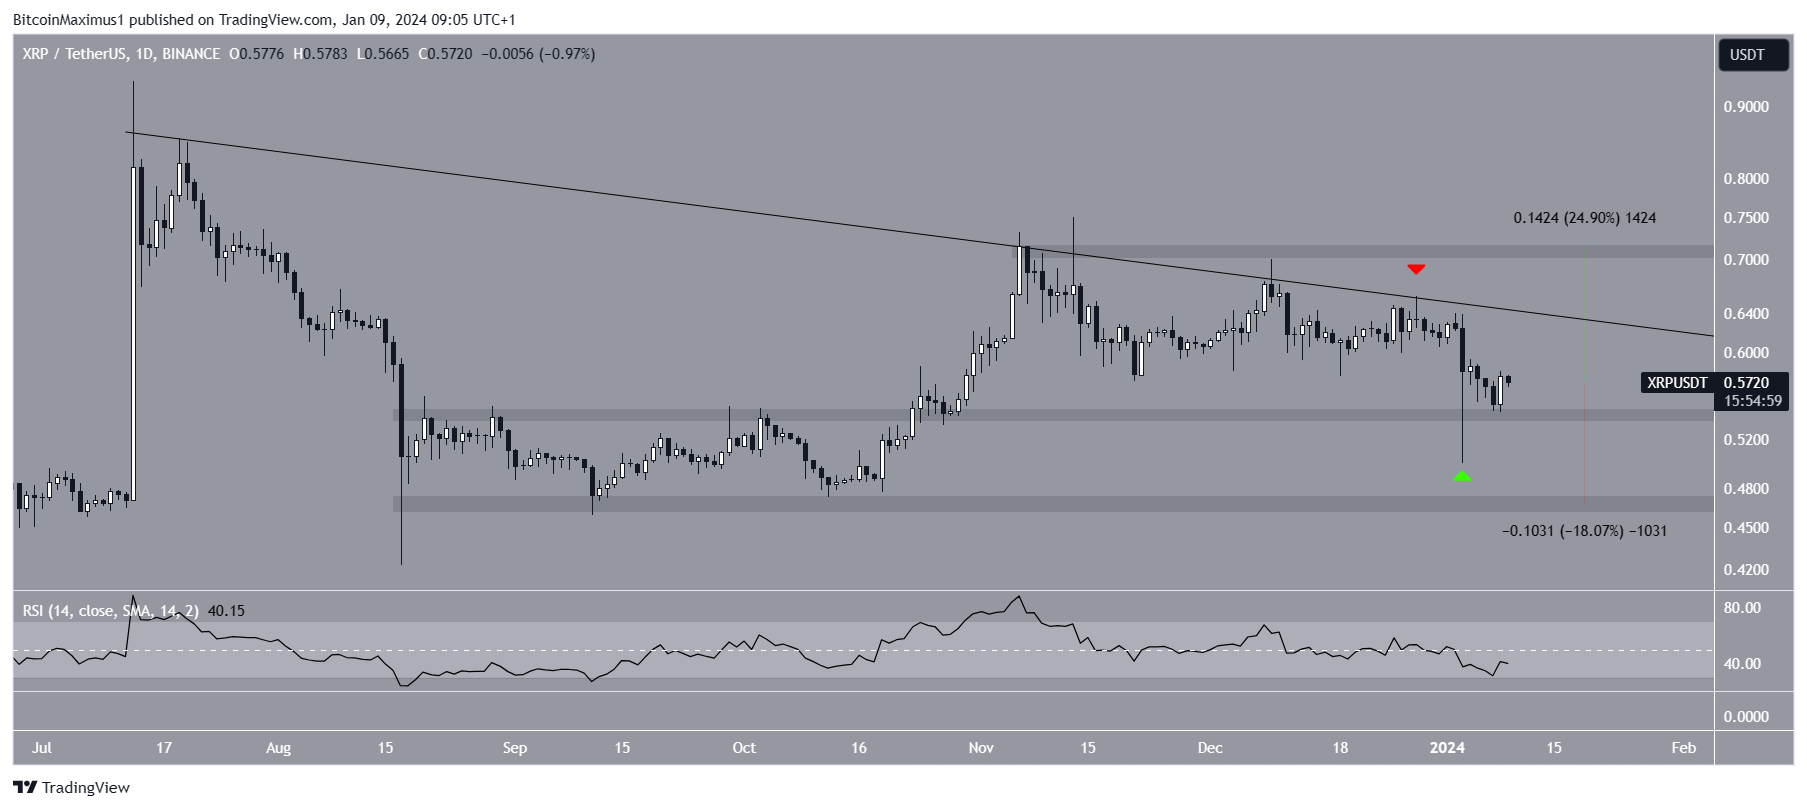
The technical analysis from the six-hour time frame does not confirm the trend’s direction. This is because the price action and RSI give conflicting signs.
The price action shows that XRP has fallen under a shorter-term descending resistance trend line since July 2023. The trend line has been validated numerous times, most recently in December (red icon).
The price fell afterward and validated the $0.54 area as support, creating a long lower wick. XRP trades above this horizontal area. The RSI gives a bearish reading since the indicator falls below 50.
So, whether the XRP price breaks down from the $0.54 area or breaks out from the descending resistance trend line instead will determine the future XRP trend.

A successful XRP breakout can lead to a 25% uptrend to the next resistance at $0.70. On the other hand, a breakdown can cause an 18% drop to the closest support at $0.47.
For BeInCrypto‘s latest crypto market analysis, click here.
XRP: Everything You Need to Know About Ripple Labs’ Currency! – YouTube
Top crypto platforms in the US | January 2024
![]()
Coinbase
Coinbase” target=”_blank”>Explore →
![]()
iTrustCapital
iTrustCapital” target=”_blank”>Explore →
![]()
Metamask Portfolio
Metamask Portfolio” target=”_blank”> Explore →
![]()
UpHold
UpHold” target=”_blank”>Explore →
![]()
eToro
eToro” target=”_blank”>Explore →
![]()
BYDFi
BYDFi” target=”_blank”>Explore →
Explore more
The post Will Ripple (XRP) Price Dip Again, or Has the Uptrend Finally Begun? appeared first on BeInCrypto.
