
Traders are keeping a careful eye on the XRP charts as technical indicators indicate a potential shift in momentum for the XRP price.
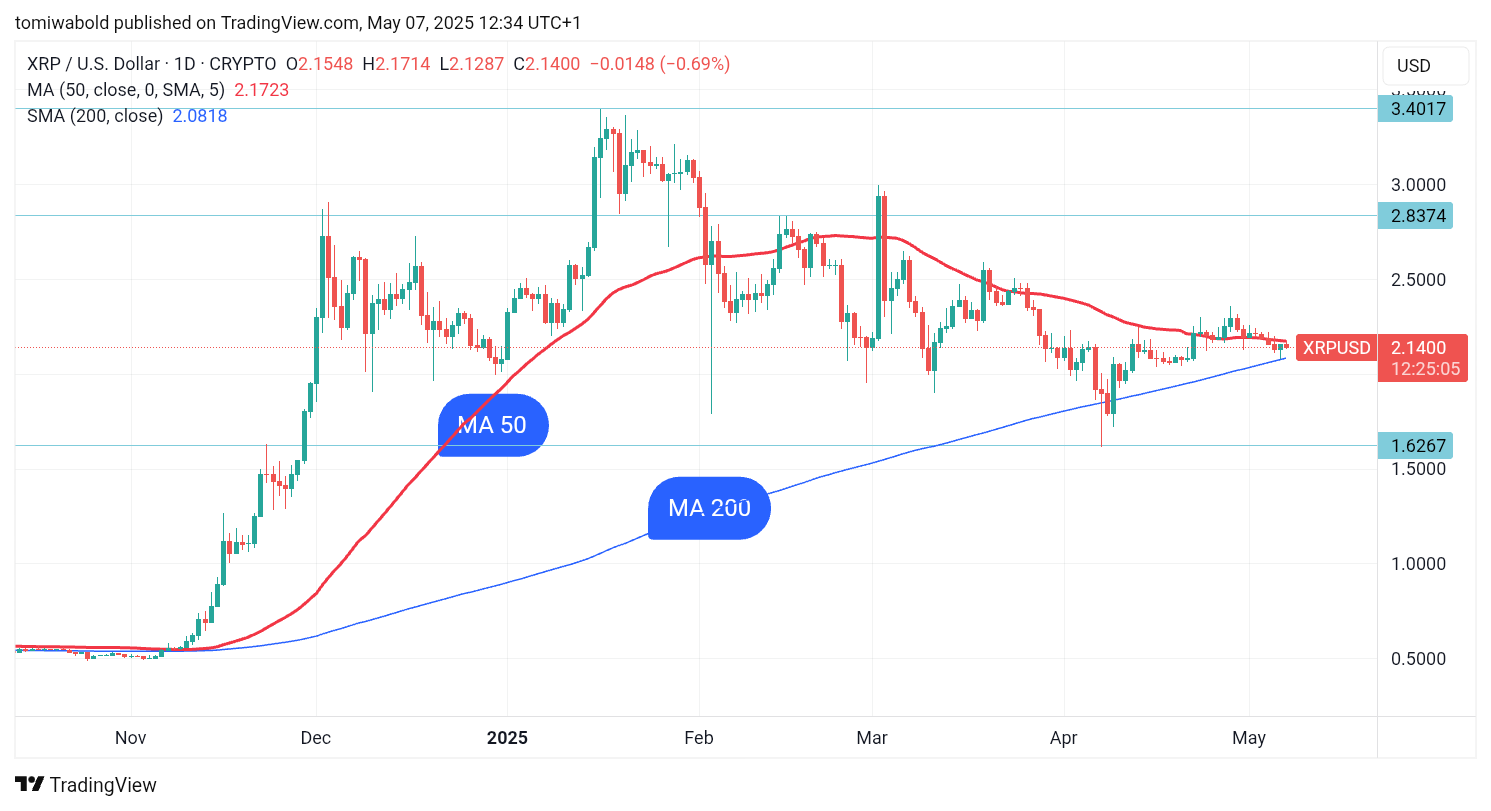
The daily Simple Moving Average (SMA) 50 for XRP has started to turn downward, with the gap between it and the daily SMA 200 narrowing. If this shorter-term moving average crosses below the longer-term SMA 200 in the days ahead, it would form what traders refer to as a “death cross,” a pattern that signals potential bearish momentum.
A “death cross” does not ensure a price collapse, but it does indicate a steady loss of momentum. XRP has struggled to regain bullish momentum recently, stalling near the daily SMA 50 amid the broader market uncertainty.
In the past, death cross formations for XRP have led to extended periods of consolidation, or bottoming, for the XRP price. The last time XRP experienced a death cross was in May 2024, which preceded a lengthy consolidation that lasted several months before XRP began a bull run in November of the same year.
Key levels to watch
The XRP price has largely stalled near the daily SMA 50 at $2.172 since late April. Bulls’ attempts to decisively breach this key level culminated at highs of $2.36 on April 28 before XRP began to drop again.
You Might Also Like

Following days of dropping, XRP plunged beneath the daily SMA 50 to hit lows of $2.07, which coincides with the daily SMA 200 before rebounding but remains below the daily SMA 50.
At press time, XRP was up 2.64% in the last 24 hours to $2.14 but down 4.23% weekly.
According to crypto analyst Ali, key levels to watch for XRP are $2 and $2.26. A decisive close outside this range could set the tone for the next major trend.