
XRP is up 15.4% over the past 30 days but has dropped 8.6% in the last four, highlighting growing short-term pressure. Despite the monthly gains, XRP remains the third-worst-performing asset among the top 20 cryptocurrencies, outperforming only BNB and TRX during this period.
Momentum indicators like RSI are attempting to stabilize, but the formation of a red Ichimoku cloud and weakening EMA structure raise concerns. With key resistance levels overhead and a possible death cross forming, XRP faces a pivotal moment in determining its next direction.
XRP RSI Rebounds to Neutral Zone After Steep Drop
XRP’s Relative Strength Index (RSI) has rebounded to 47.52, rising sharply from yesterday’s 35.18 after a steep decline from 65.76 four days ago and a recent peak of 74.22 six days ago.
This rapid swing reflects a shift in momentum after a period of strong selling pressure.
While the RSI is still below the neutral threshold, the move upward may indicate early signs of renewed interest or a short-term relief rally following recent losses.
Recently, US judge Analisa Torres rejected the joint settlement request from the SEC and Ripple, calling it procedurally improper—meaning the original penalties and injunctions remain in place.
The XRP lawsuit continues, with both parties now needing to either refile correctly or resume the appeals process, which could influence its price in the next weeks.
The RSI is a momentum oscillator that ranges from 0 to 100 and helps identify overbought or oversold conditions in the market.
Values above 70 typically suggest an asset is overbought and could be due for a correction, while values below 30 indicate it may be oversold and poised for a bounce.
With XRP’s RSI now sitting near the midpoint at 47.52, the asset is in a neutral zone—neither overbought nor oversold. This could mean price consolidation ahead, or a potential move toward retesting resistance levels if upward momentum builds.
Momentum at Risk as XRP Faces Red Cloud Formation
XRP’s Ichimoku chart shows a shift in market structure. After several sessions of weakness, the price tested the blue Tenkan-sen line.
Notably, the cloud ahead has just turned red for the first time in several days—an early warning that bearish pressure could increase.
While the current candle attempts to close above the Tenkan-sen, the broader structure now faces added resistance, especially as the price approaches the lower edge of the cloud.
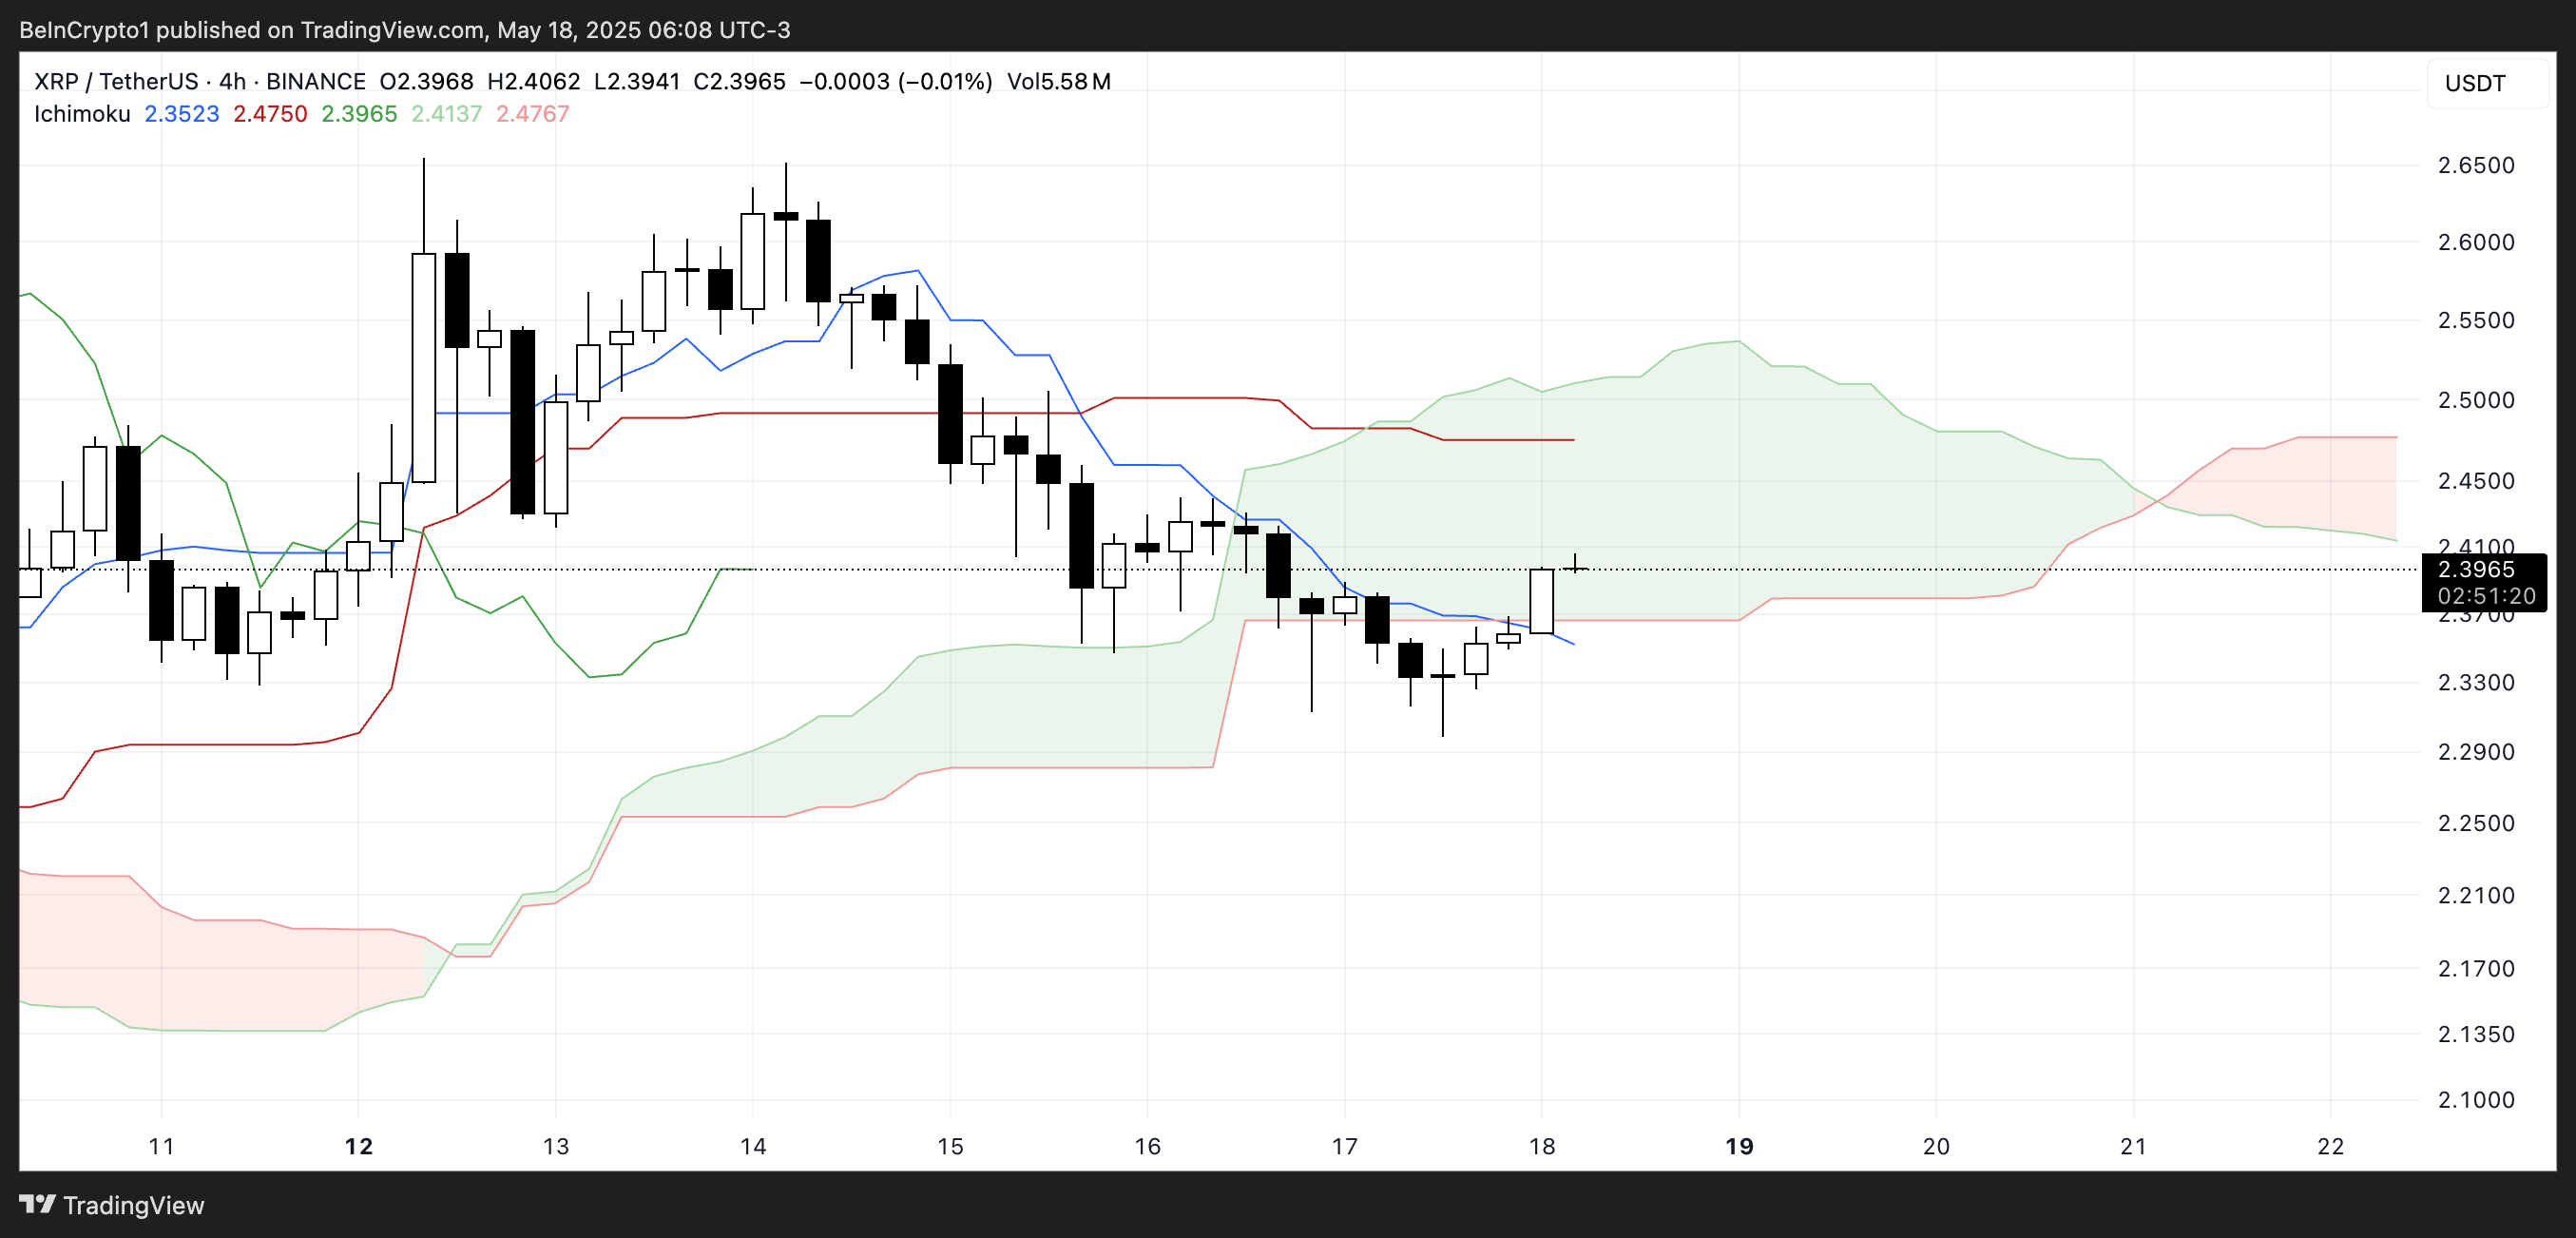
The narrowing gap between the red Kijun-sen and the price line adds to the short-term tension, reinforcing that bulls must step in now or risk losing momentum.
The cloud’s color shift suggests that upside traction could be limited even if XRP manages to enter the cloud.
If rejection occurs here, the path of least resistance may shift downward, opening the possibility for a new leg of correction.
XRP Nears Key Resistance as EMA Death Cross Threatens
XRP’s EMA lines are signaling potential trouble ahead, with the short-term averages dropping sharply over the past four days.
A death cross—where short-term EMAs cross below long-term ones—appears increasingly likely if current momentum doesn’t reverse.
XRP price is now hovering near a key resistance zone around $2.40, where both short-term EMAs are converging. A strong breakout above this area could invalidate the bearish setup and open the path toward a potential move to $2.65.
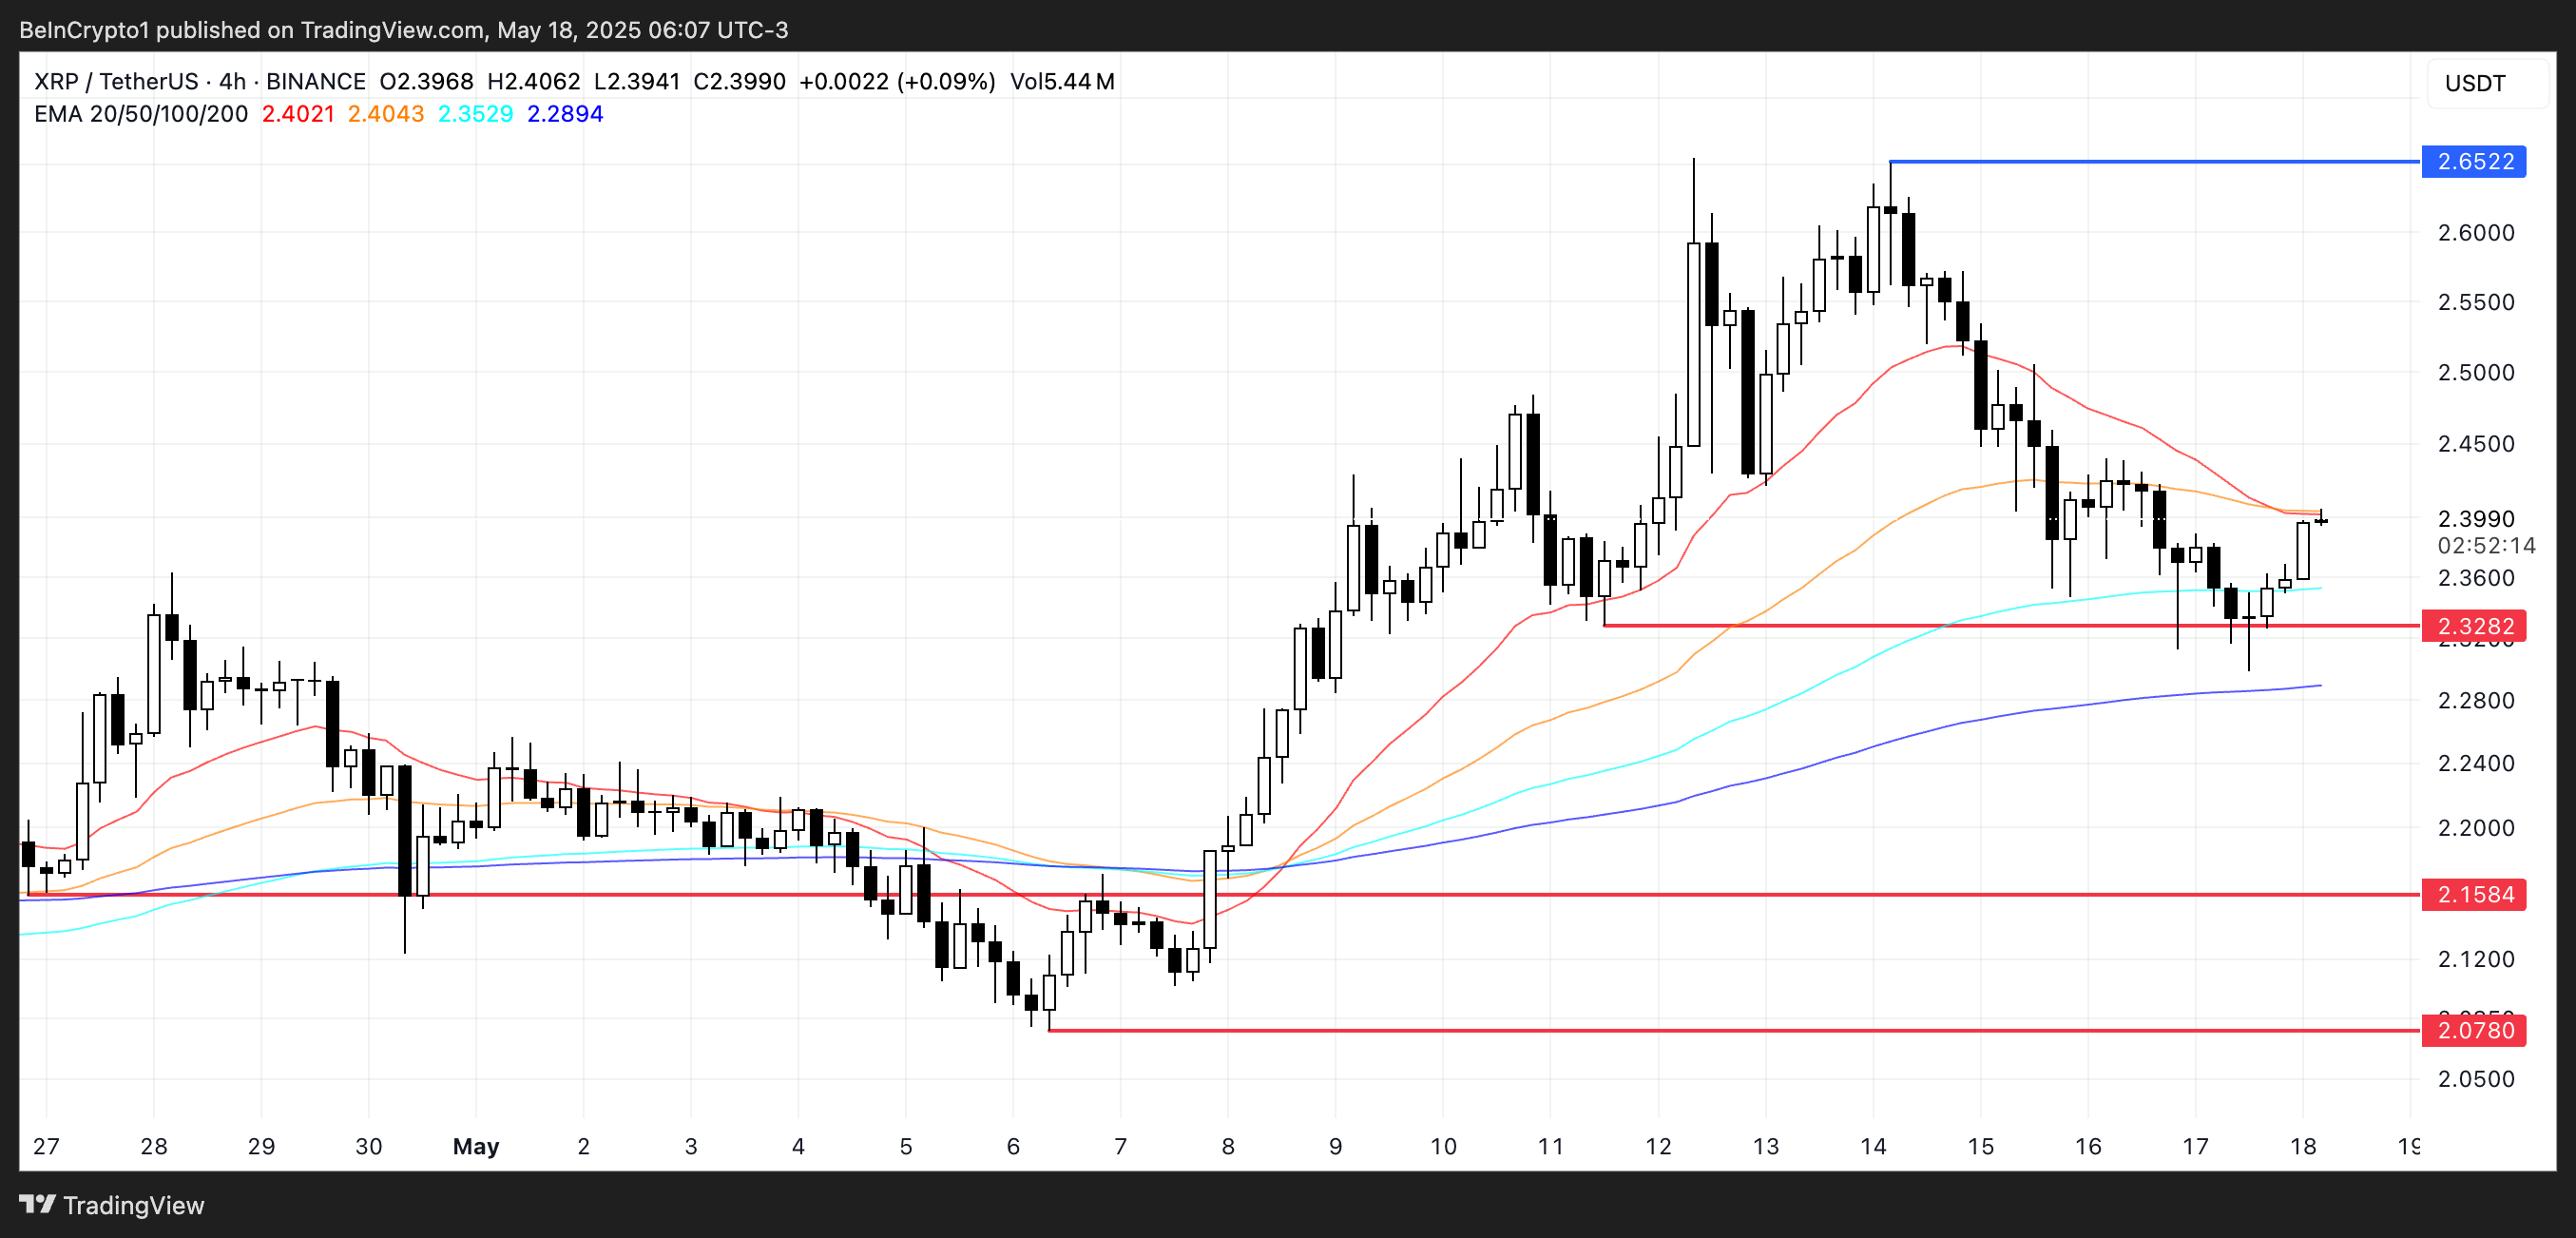
However, failure to reclaim that resistance may leave XRP vulnerable to renewed downside pressure.
The $2.32 level, which held as support in recent sessions, will be critical—if it fails on another retest, the next downside targets lie around $2.15 and $2.07.
With the EMAs turning lower and resistance overhead, XRP must generate significant buying pressure soon to avoid slipping further.
The post XRP Lacks Buying Activity Below $2.50 – More Losses Ahead? appeared first on BeInCrypto.