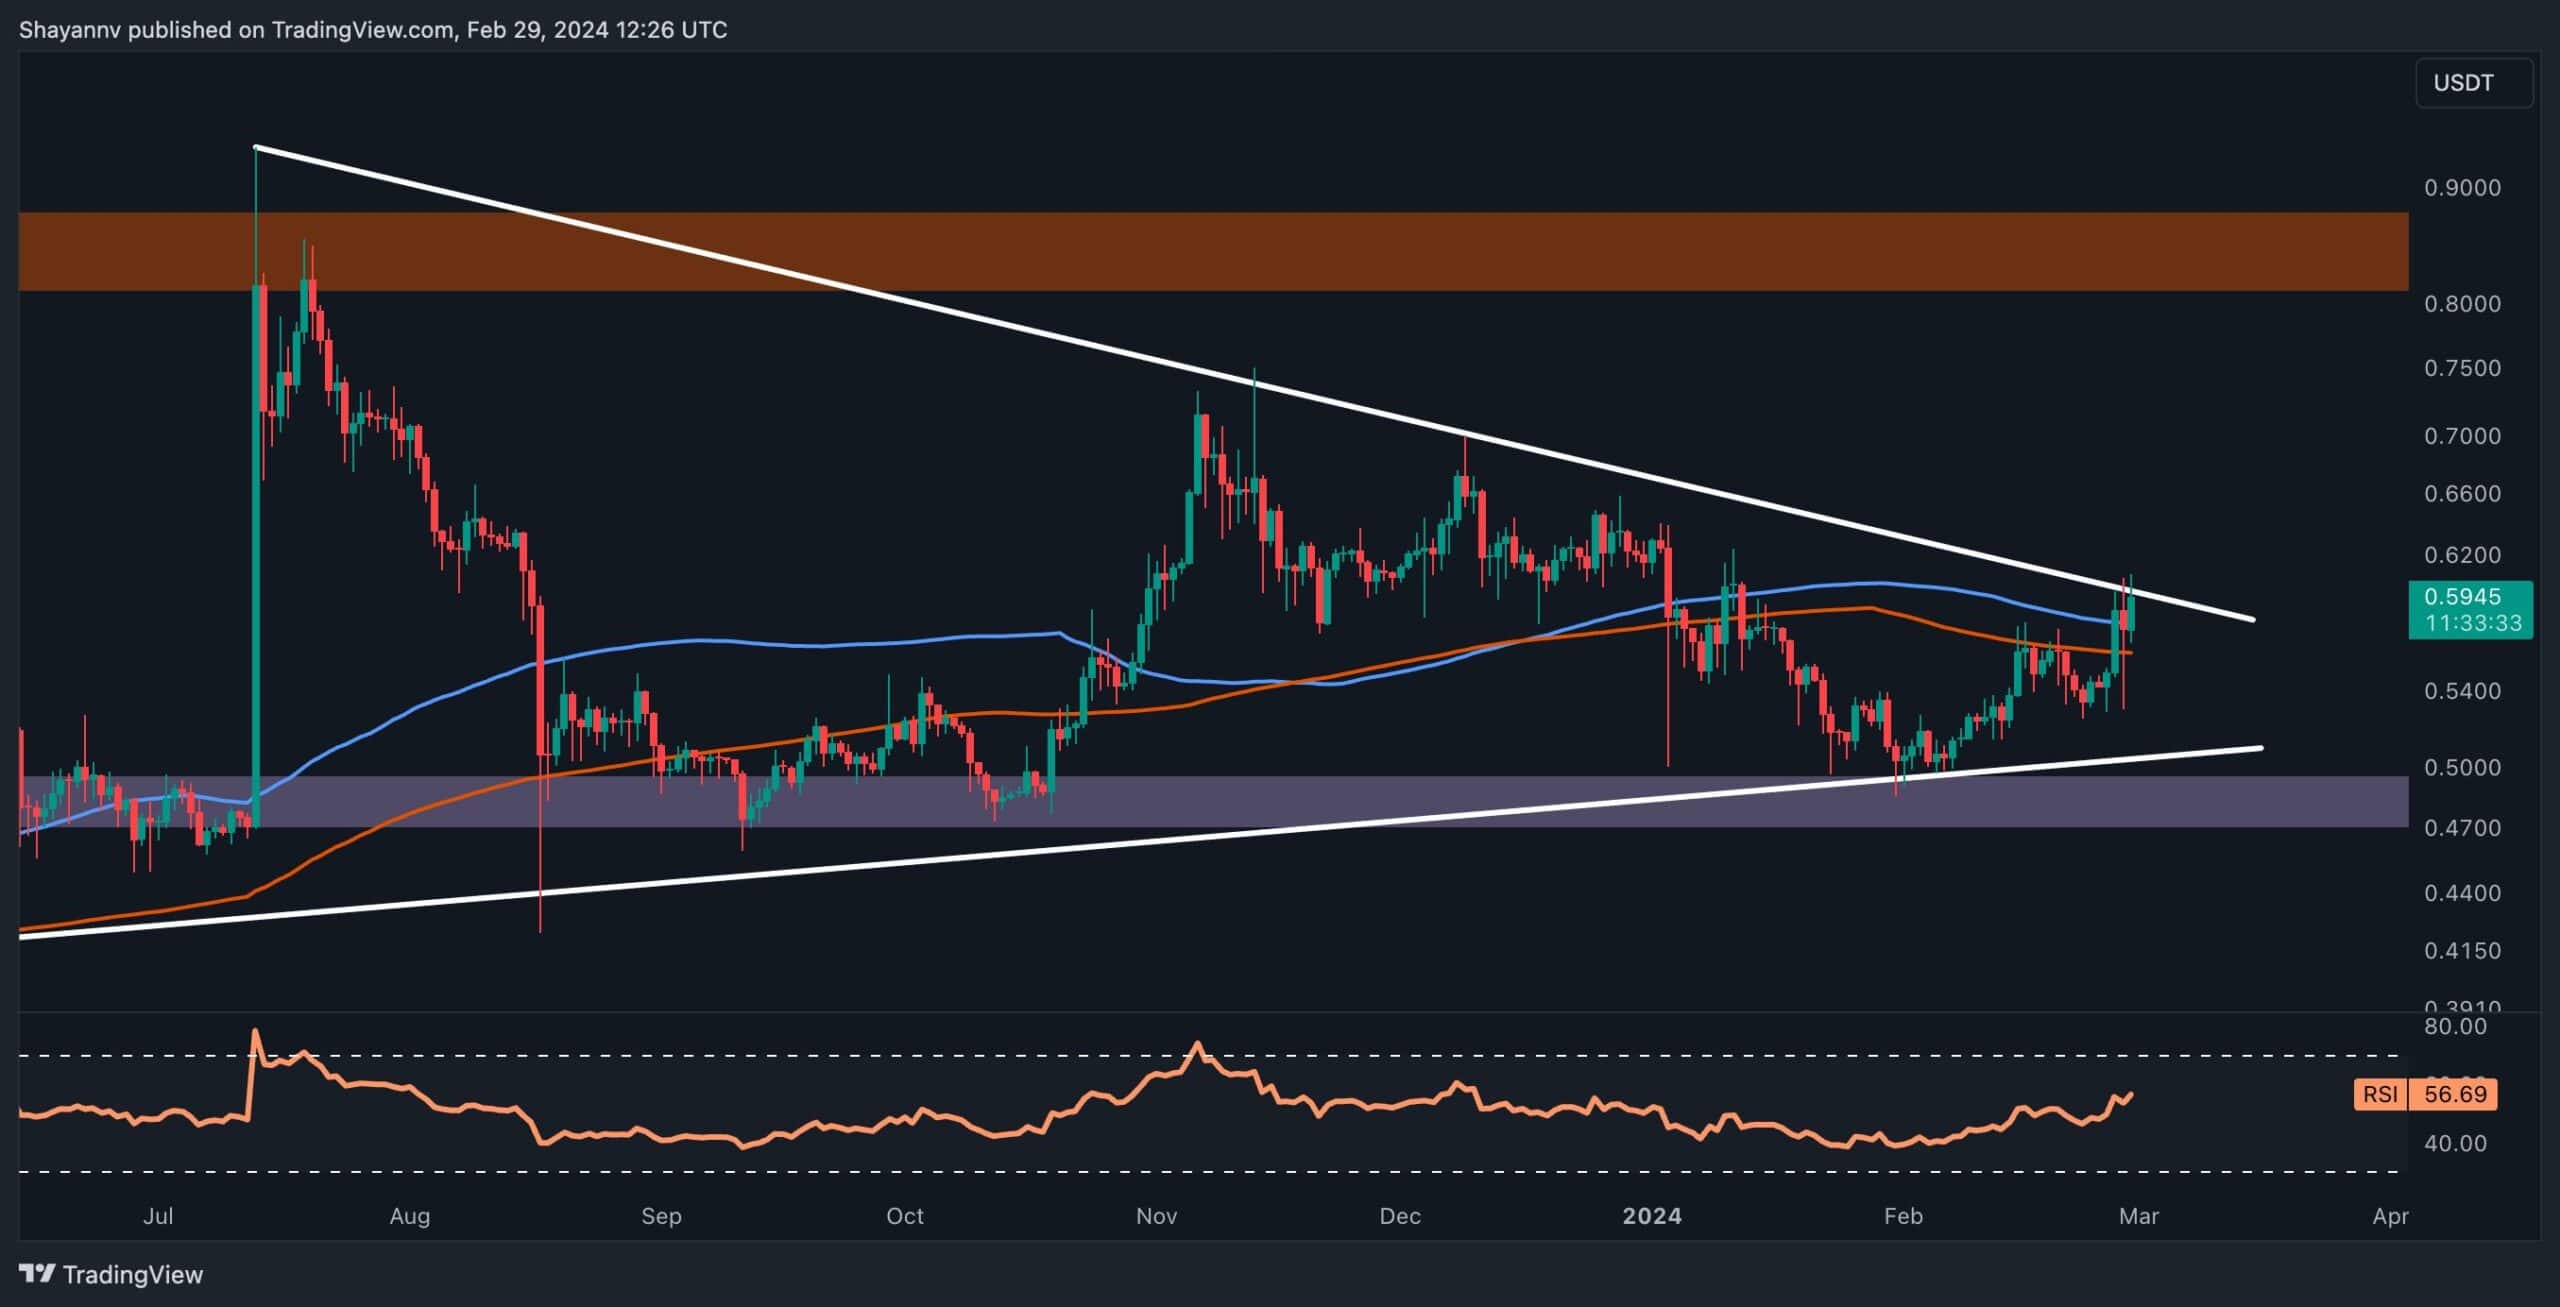
Ripple’s price movement has been characterized by a sideways triangle pattern spanning multiple months, culminating in a recent uptick towards a crucial resistance zone positioned at the upper boundary of the triangle.
This development suggests an imminent breakout, which will play a pivotal role in determining Ripple’s future direction.
By Shayan
The Daily Chart
Upon examining the daily chart, Ripple’s price surge becomes evident as it nears a critical resistance area represented by the dynamic upper boundary of the triangle pattern. Concurrently, the cryptocurrency approaches the narrowing range of the triangle, heightening expectations for an imminent breakout in either direction.
Given the prevailing market sentiment and the optimistic outlook within the cryptocurrency industry, there is an expectation for Ripple’s price to breach the upper threshold of the triangle, triggering a bullish rally targeting the significant $0.8 resistance level.
However, it’s essential for traders to remain mindful of the alternative scenario where a rejection could lead to increased market volatility and sideways consolidation.
The 4-Hour Chart
A more detailed analysis of the 4-hour chart reveals a notable surge in price following heightened volatility around the $0.53 level, culminating in a resistance encounter near $0.6. This resistance zone aligns with the dynamic resistance of a descending trendline spanning several months, indicating significant selling pressure.
Despite these challenges, Ripple’s price remains bounded by the dynamic ascending trendline and the notable resistance at $0.6, suggesting the potential for prolonged consolidation within this pivotal range until a breakout occurs.
Should there be a sudden breach above the descending trendline and the $0.6 threshold, attention will shift toward the $0.8 resistance level as the next focal point for Ripple’s price trajectory.
Binance Free $100 (Exclusive): Use this link to register and receive $100 free and 10% off fees on Binance Futures first month (terms).
Disclaimer: Information found on CryptoPotato is those of writers quoted. It does not represent the opinions of CryptoPotato on whether to buy, sell, or hold any investments. You are advised to conduct your own research before making any investment decisions. Use provided information at your own risk. See Disclaimer for more information.
Cryptocurrency charts by TradingView.
