
The headline is no rhyming metaphor — the XRP price is indeed on “thin ice,” and it is the Bollinger Bands that show on different time frames how fragile the setup has become. At $3.01, the coin is caught between support and resistance, and each time frame presents a different scenario. However, some sort of clarity can be achieved there.
On the weekly chart, XRP is on the upper half of the bands, though it has already pulled back from the $3.60 peak seen earlier this month. The middle band, around $2.57, is the main safety net.
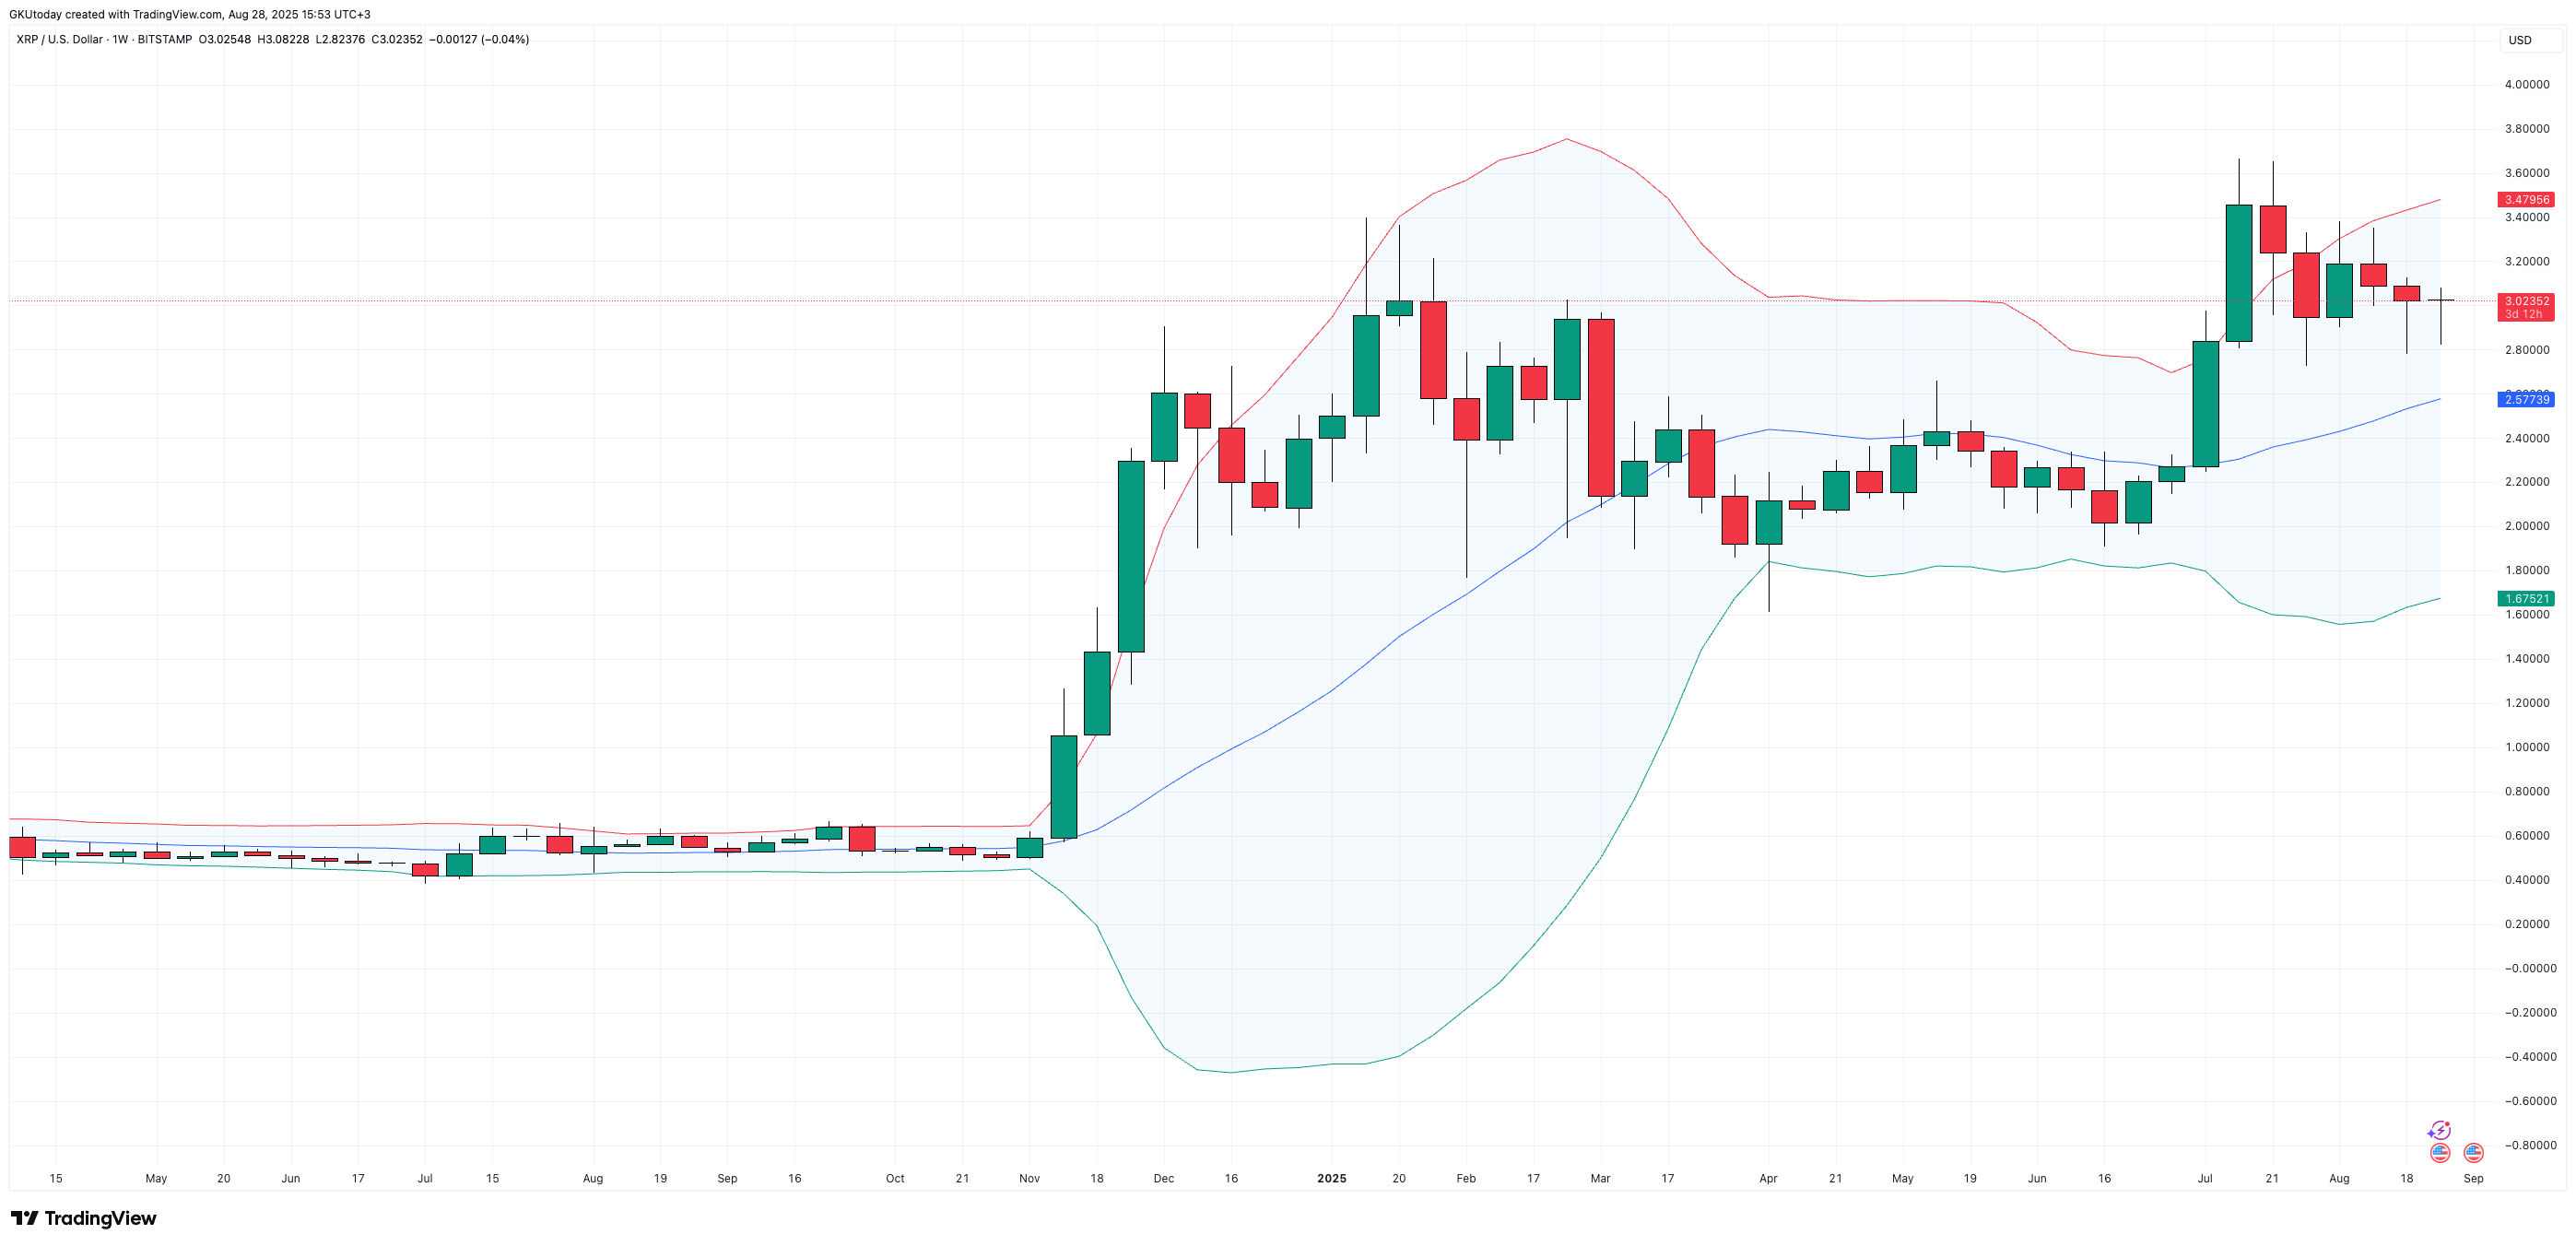
Staying above it would maintain the bullish bias, while falling below it could push the token closer to the $1.80s. On the upside, the red band near $3.47 is the level that bulls need to reclaim before discussing higher targets.
XRP price uncertainty
The daily chart looks tighter and more pressing. XRP is right on the midline, near $3.05, after weeks of back-and-forth candles. The upper band is set at around $3.30, and the lower band is set at around $2.81. This range makes one thing clear: closing above the midpoint could give XRP another shot at the $3.20-$3.30 zone. Lose it, however, and the $2.80s is back into focus.
You Might Also Like

Finally, on the 12-hour frame, XRP continues to bounce around the mid-band at $3.01. The upper band, at $3.11, caps moves, and the lower band, at $2.86, catches dips.
But what matters the most is in the upper zone of the bands, so a bullish setup remains. At the same time, the situation can quickly change even if a small push down occurs.