Disclaimer: The opinions expressed by our writers are their own and do not represent the views of U.Today. The financial and market information provided on U.Today is intended for informational purposes only. U.Today is not liable for any financial losses incurred while trading cryptocurrencies. Conduct your own research by contacting financial experts before making any investment decisions. We believe that all content is accurate as of the date of publication, but certain offers mentioned may no longer be available.
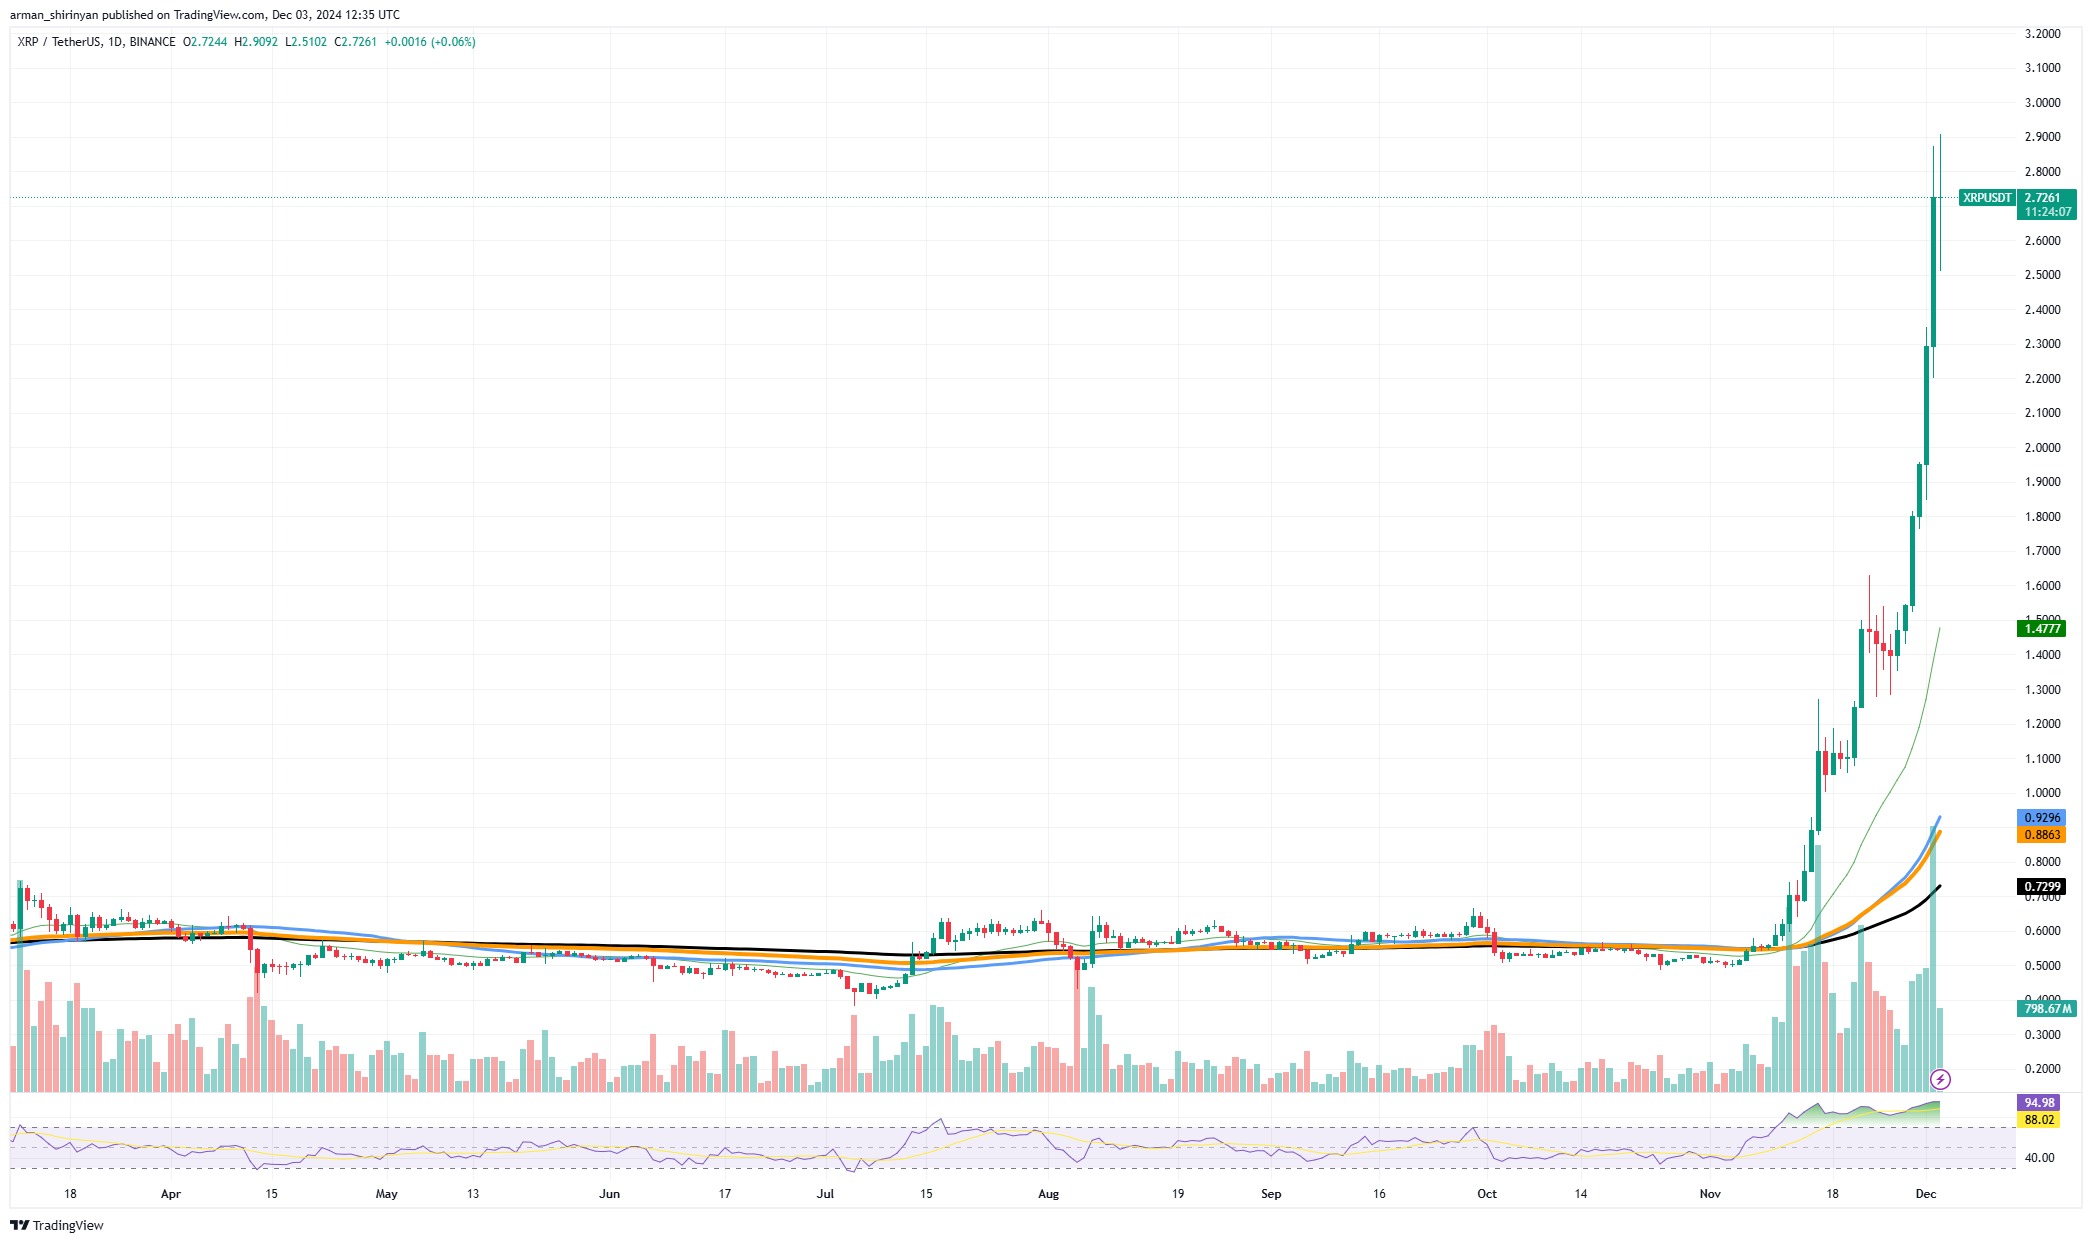
The recent surge in XRP’s price has driven it to levels not seen in years. A possible reversal candle on the daily chart, however, suggests that the trend might be slowing down. As sellers regain control and buyers lose steam, these formations frequently signal a change in market sentiment – usually from bullish to bearish.
At $2.76, the price of XRP is currently exhibiting signs of hesitancy close to the psychological $3 resistance level. Historically, this price point has proven to be a difficult obstacle, frequently serving as a barrier where traders lock in profits. With a long wick above the body, the reversal candle indicates strong selling pressure at these high levels. The recent breakout of XRP from important moving averages, including the 50-day and 200-day exponential moving averages, indicates that the overall uptrend is still in place for the time being.

The asset is significantly overbought, though, according to RSI readings above 88, which raises concerns about a potential short-term decline. In the event of a reversal, the previous breakout zone, which is located around $2.40, provides immediate support. The price may move toward the 21-day EMA, a frequently observed level in bullish trends at $2.00, in the event of a more severe correction.
On the other hand, XRP may be able to move higher, possibly reaching $3.50 or even higher if it is able to invalidate the reversal signal and break above $3 with significant volume. Increased market participation and fresh buying momentum would be necessary for this, though.
Ethereum’s high potential
According to its recent price performance, Ethereum, the second-largest cryptocurrency, may be preparing for a surge toward the crucial $4,000 mark. Ethereum is currently trading close to $3,610 after going through a significant upward trend that was bolstered by a number of bullish indicators that are visible on the chart. Ethereum has recovered above critical moving averages, which is one of its strongest points.
With the 50-day EMA crossing above the 200-day EMA, a golden cross — a well-known bullish pattern — has been indicated. As traders expect continued upward movement, this formation frequently draws in more buying momentum. Ethereum is still above the 21-day EMA, which has served as a dynamic support level throughout this rally. Given that recent trading activity has been steadily higher than it was during the bearish months earlier this year, volume levels also exhibit encouraging trends.
This shows that investors’ confidence and interest are growing, which is essential for Ethereum to challenge $4,000. Ethereum is not without its difficult is, though. At 65, RSI levels are getting close to overbought territory, which may cause a brief decline or consolidation. Before Ethereum tries to break higher again, the resistance level around $3,700 might serve as a barrier. The general outlook of the Ethereum market is still positive, especially in light of the growing use of layer-2 scaling solutions and the ongoing expansion of DeFi applications.
But if momentum is lost, Ethereum might retest lower support levels of $3,300 or even $3,000. It will take consistent volume and bullish sentiment for Ethereum to hit $4,000. Strong buying interest and a clear break above $3,700 would pave the way for a higher move. On the other hand, any indications of waning momentum might cause a halt or even a turnaround.
Dogecoin’s flag
On its daily chart, Dogecoin is displaying an ascending flag pattern, which is a traditional bullish continuation configuration. With a narrowing channel and higher lows and highs, the price has entered a consolidation phase after its spectacular rally in November. Dogecoin is holding above important moving averages such as the 21-day EMA, which serves as immediate support at $0.38 and is currently trading at about $0.418.
The flag pattern structure depends on this dynamic support. An extension of the previous bullish trend may be indicated by a breakout above the flag’s upper trend line, which is currently around $0.44. As is common when flags are forming, the volume has somewhat tapered off during the consolidation.
A notable increase in purchasing volume with an initial target of $0.50 could validate the breakout. If momentum continues, DOGE may try to reach the psychological level of $0.60, which corresponds to its previous resistance zones. However, prudence is required. Should DOGE fail to maintain the 21-day EMA, it may move closer to the $0.36 support level.
The 50-day EMA currently sits in the $0.30 region, which could be retested if this zone is reached, invalidating the flag pattern. Short-term pullbacks are possible, as indicated by the RSI’s current hovering around 71, which is just outside of the overbought zone. As a speculative asset, DOGE continues to gain traction during times of increased retail interest, but the overall market sentiment is still positive.


