The Polygon (MATIC) price has decreased since December 17, 2023. It recently fell below a horizontal resistance area.
Despite the decrease, MATIC still trades above an ascending support trend line. Can it begin a bounce?
Polygon Falls Below Resistance
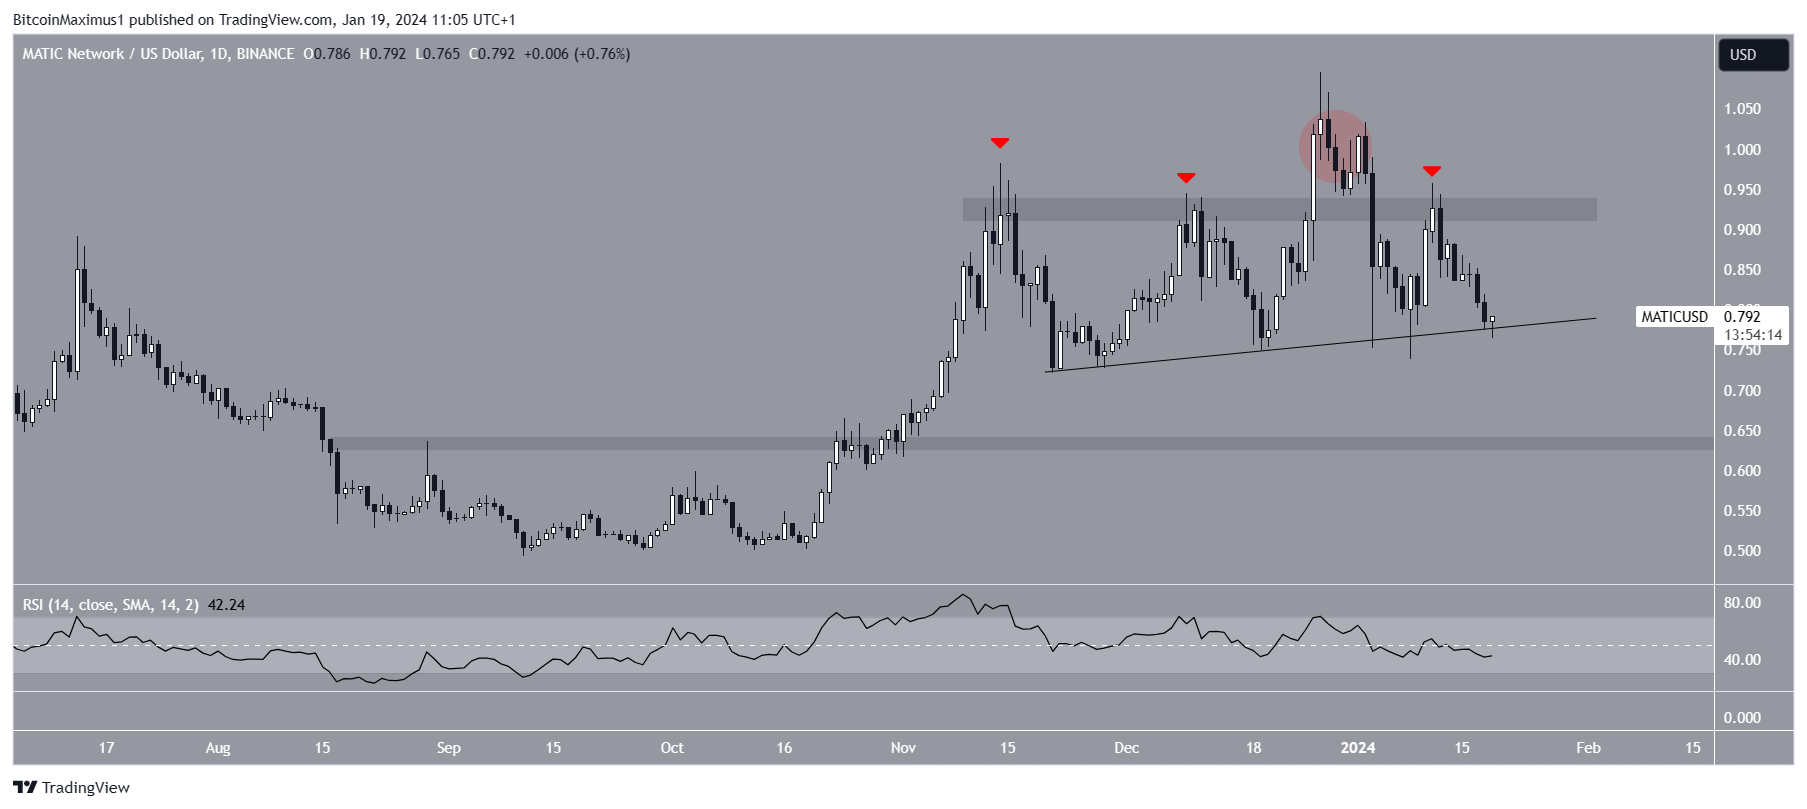
The daily time frame technical analysis shows that the MATIC price has traded below the $0.95 horizontal resistance area since November 2023.
The price briefly moved above this area in December (red circle) but fell below it shortly afterward. This, in turn, turns the breakout into a deviation. So far, the resistance area has rejected the MATIC price three times (red icons). After the final rejection, MATIC returned to an ascending support trend line.
The daily RSI gives a bearish reading. Traders utilize the RSI as a momentum indicator to assess whether a market is overbought or oversold and whether to accumulate or sell an asset.
If the RSI reading is above 50 and the trend is upward, bulls still have an advantage, but if the reading is below 50, the opposite is true. The RSI is falling and below 50, both signs of a bearish trend.
Unlike the price action and RSI, news about Polygon is positive. A report by Electric Capital noted that Polygon was the chain that drew the 2nd most new developers in 2023, with 6,208, trailing behind only Ethereum.
Read More: How To Buy Polygon (MATIC) and Everything You Need To Know
MATIC Price Prediction: How Long Will Decrease Continue?
A look at the movement over the past five months gives a bearish MATIC outlook. This is because of the wave count.
Elliott Wave theory involves the analysis of recurring long-term price patterns and investor psychology to determine the direction of a trend.
Read More: How To Use the Polygon Bridge: A Step-by-Step Guide
The most likely wave count suggests that the MATIC price has completed a five-wave upward movement (black) and has started an A-B-C correction. If so, it is currently in the C wave of this correction.
The most likely level for the bottom is at the $0.63 horizontal support area, 20% below the current MATIC price.
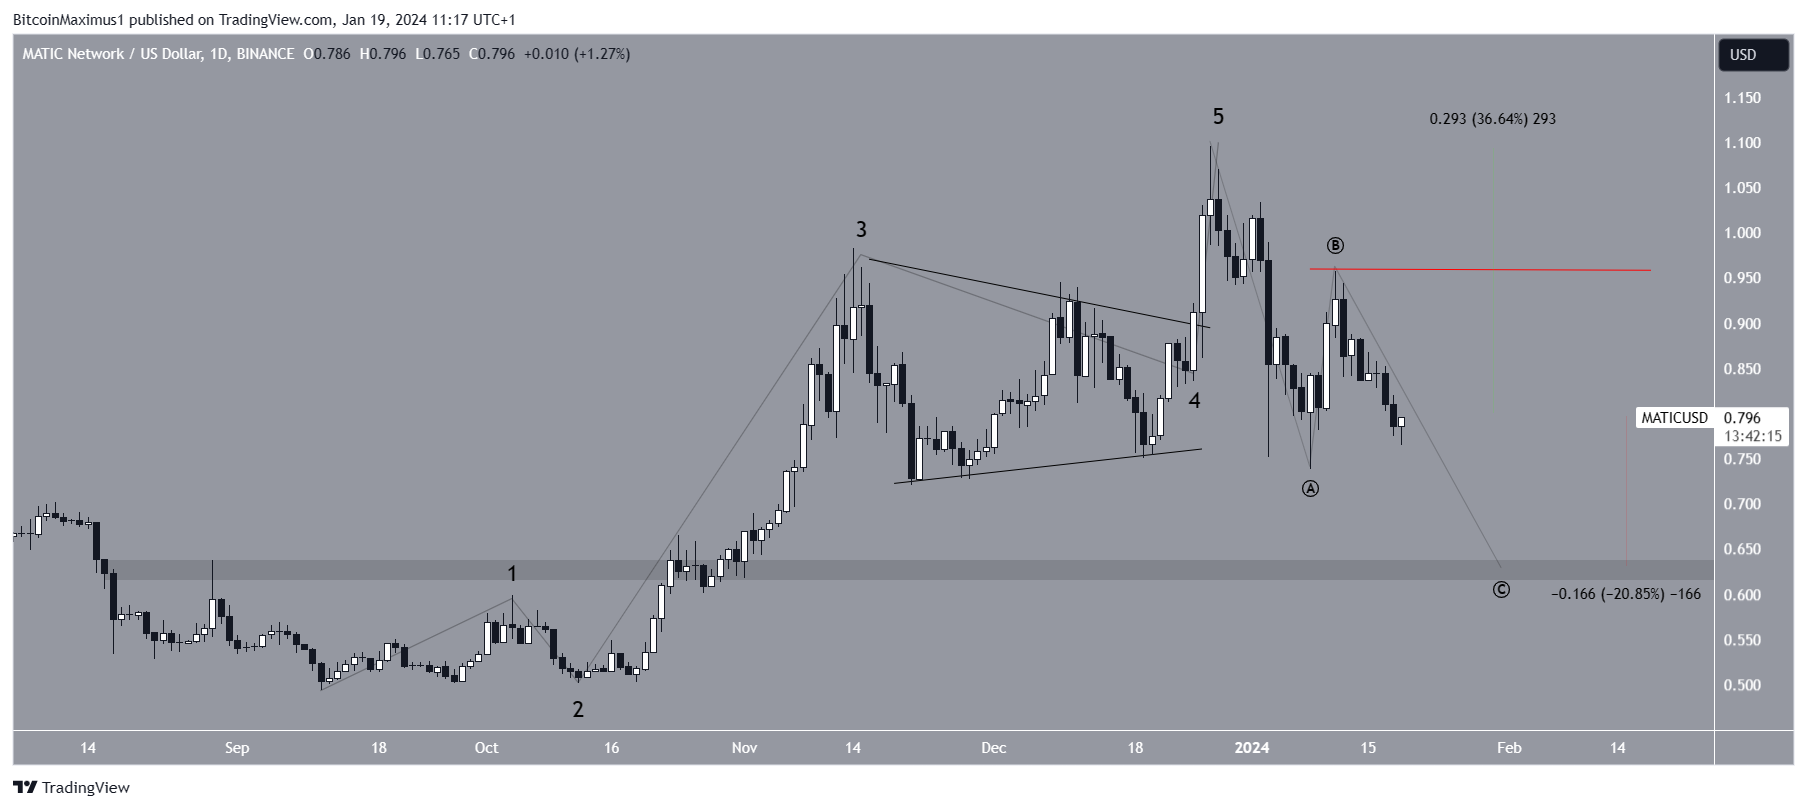
Despite this bearish MATIC prediction, moving above wave B’s high (red) of $0.96 will mean the local bottom is in. Then, MATIC can increase by nearly 37%, reaching the December 2023 high at $1.10.
For BeInCrypto’s latest crypto market analysis, click here.
Read More: How To Create Polygon Smart Contract with Private RPC Endpoint
![]()
Coinbase
Coinbase” target=”_blank”>Explore →
![]()
iTrustCapital
iTrustCapital” target=”_blank”>Explore →
![]()
Metamask Portfolio
Metamask Portfolio” target=”_blank”> Explore →
![]()
UpHold
UpHold” target=”_blank”>Explore →
![]()
eToro
eToro” target=”_blank”>Explore →
![]()
BYDFi
BYDFi” target=”_blank”>Explore →
Explore more
The post Analyzing the Recent Polygon (MATIC) Decrease: Can It Bounce Back Above $1? appeared first on BeInCrypto.