 Price Falls to All-Time Low – What’s Next?")
The Arbitrum (ARB) price broke down from the $0.90 support area at the beginning of September and fell to a new all-time low today.
There are no bullish reversal signs in either the price action or the RSI, suggesting a likely decrease to the next closest Fib support area.
Arbitrum Price Gets Rejected – Falls to All-Time Low
The ARB price has fallen under a descending resistance line since April 18, when it reached an all-time high price of $1.82.
Initially, the price bounced at the $0.90 horizontal support area on June 15 (green icon). However, the bounce was insufficient in causing a breakout from the descending resistance line.
On August 15, the ARB price was rejected by the resistance line again. This eventually caused a breakdown from the $0.90 horizontal support area at the beginning of September.
Read More: Best Upcoming Airdrops in 2023
On September 11, ARB reached a new all-time low of $0.77. This was 33% below its listing price of $1.18. Arbitrum is now trading only slightly above its all-time low at $0.79.
The daily RSI provides a bearish outlook. When evaluating market conditions, traders use the RSI as a momentum indicator to determine if a market is overbought or oversold and to decide whether to accumulate or sell an asset.
When the RSI reading remains above 50, the upward trend indicates that bulls continue to hold an advantage. Conversely, if the RSI reading falls below 50, it suggests the opposite, signaling potential bearish conditions. In the current scenario, the RSI is below 50 and decreasing, which are both indicative of a bearish trend.
Additionally, although the RSI attempted to create a bullish divergence (as indicated by the green line), it was unsuccessful and instead broke down, further confirming the bearish trend.
ARB Price Prediction – Where to Next?
Since the price is already at an all-time low, using an external Fib retracement on the most recent portion of the increase is required to determine the next closest support level.
Doing so gives the next closest support area at $0.64, 19% below the current price. Since there are no bullish reversal signs in place, it is likely the Arbitrum price will eventually reach it.
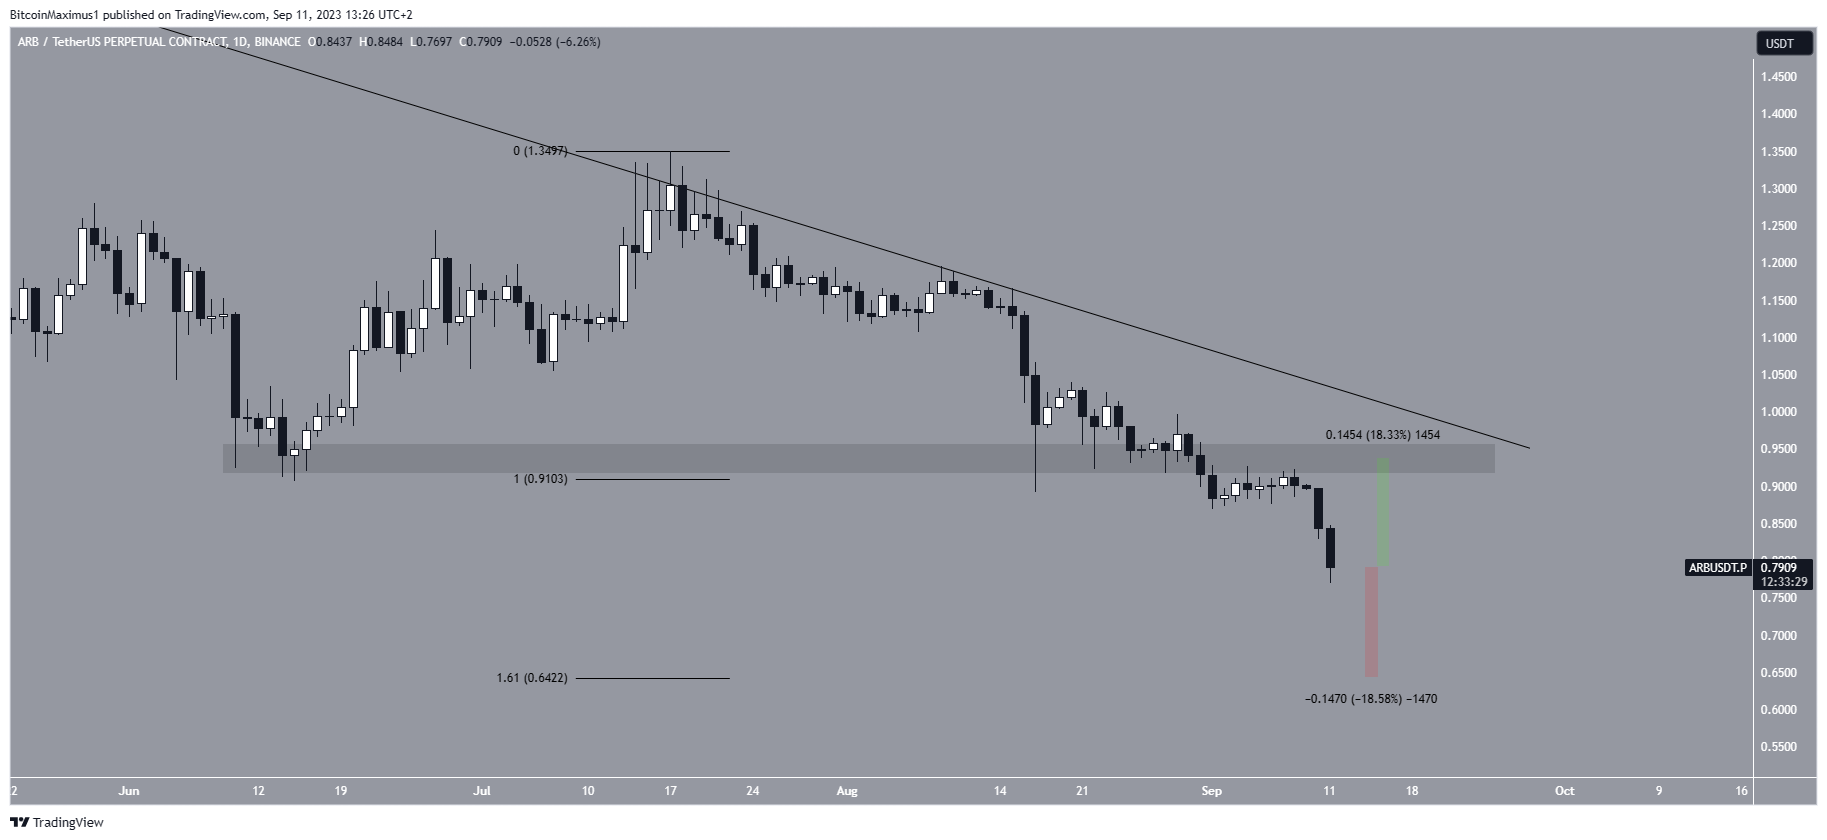
Despite this bearish ARB price prediction, a sudden momentum reversal can lead the price to retest the $0.90 area. This would amount to an increase of 18%. However, the trend cannot be considered bullish until the price recovers.
Read More: Best Crypto Sign-Up Bonuses in 2023
For BeInCrypto’s latest crypto market analysis, click here.
The post Arbitrum (ABR) Price Falls to All-Time Low – What’s Next? appeared first on BeInCrypto.