
Binance announced the launch of a new wallet on Nov. 11, but the BNB token price has fallen slightly since.
The first attempt at breaking out from the $260 area was unsuccessful. Will the second one be different?
BNB Breaks out From Resistance
The technical analysis from the daily time frame shows that the BNB token price has fallen under a descending resistance trend line since April. The decrease led to a low of $202 on Oct. 9.
The price has increased considerably since. It broke out from the descending resistance trend line on Oct. 15, culminating with a high of $258 on Nov. 10. At the time of the breakout, the trend line had been in place for 182 days.
Read more: How To Buy BNB (Binance Coin) in 4 Easy Steps
Despite the increase, BNB failed to break out from the $260 horizontal resistance area, which had been in place since June. Rather, it created a long upper wick, validating it as resistance (red icon).
There was some positive Binance news last week. On Nov. 11, Binance launched the Binance Web3 Wallet. This secure, self-custodial crypto wallet is integrated with the Binance app.
The wallet provides numerous new features, one of the most important being cross-chain token swaps carried out through the Binance bridge. The BNB team also posted a tutorial on X (formerly Twitter) on how to use the wallets.
Read More: 9 Best AI Crypto Trading Bots to Maximize Your Profits
BNB Price Prediction: Will Increase Lead to $300?
The Relative Strength Index (RSI) in the daily time frame supports the continuing of the increase.
With the RSI as a momentum indicator, traders can determine whether a market is overbought or oversold and decide whether to accumulate or sell an asset.
Bulls have an advantage if the RSI reading is above 50 and the trend is upward, but if the reading is below 50, the opposite is true. The RSI is above 50 and increasing, signs of a bullish trend.
Additionally, the bullish divergence trend line (green) that preceded the BNB price increase is still intact. A bullish divergence occurs when a momentum increase accompanies a price decrease. It often precedes bullish trend reversals.
If the BNB token breaks out from the $260 resistance, it can increase by nearly 30% and reach the next resistance at $315.
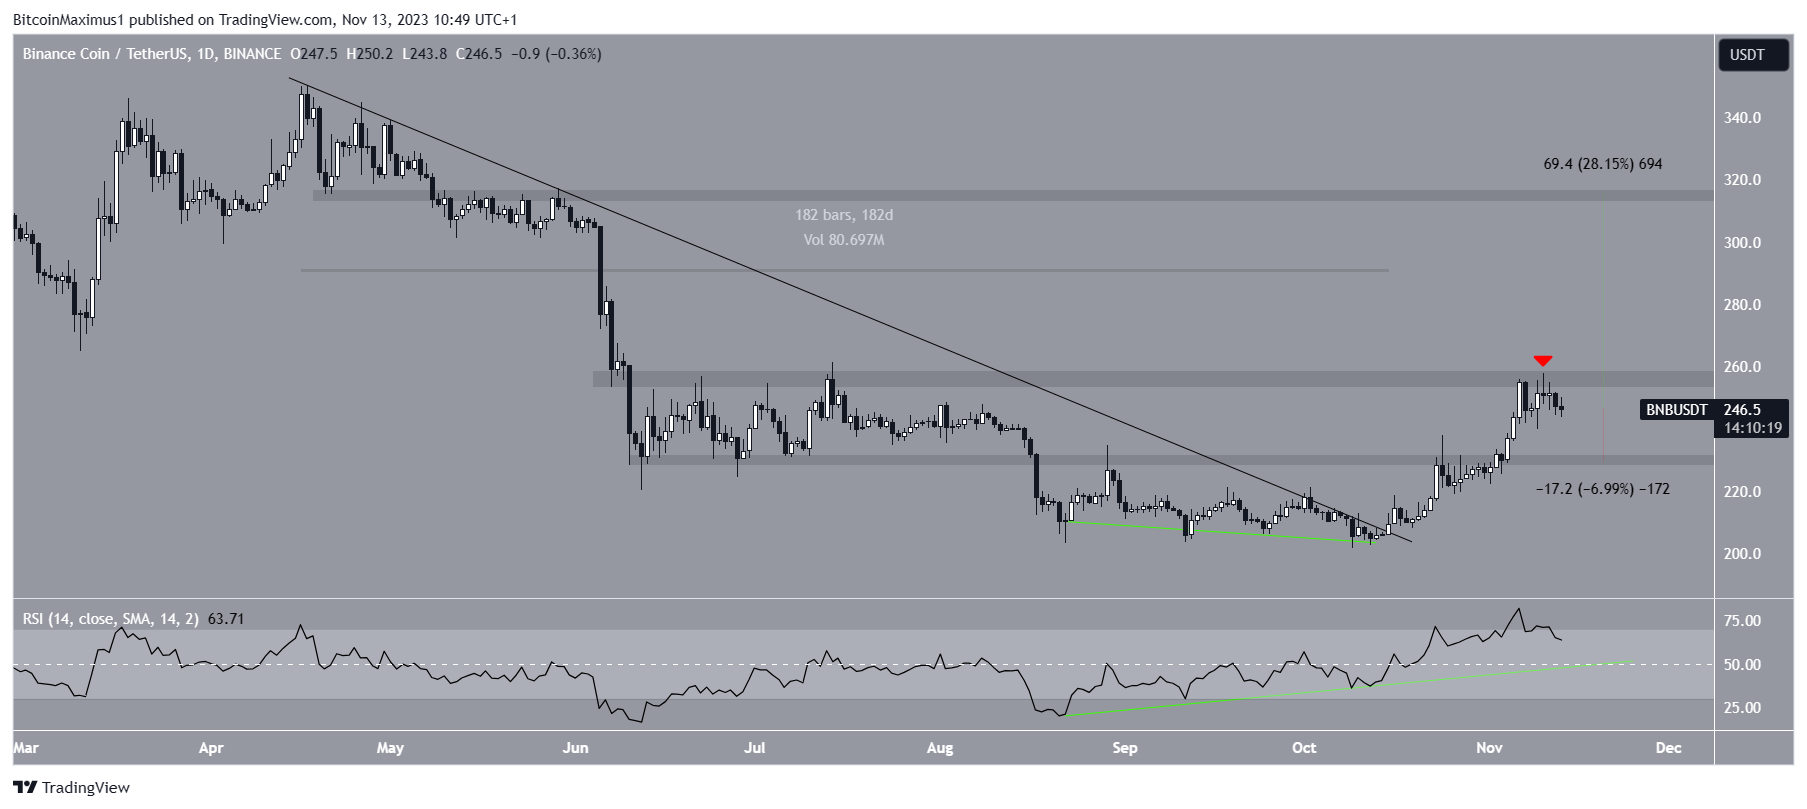
Despite this bullish BNB price prediction, failure to break out from the $260 area can lead to a 7% drop to the closest support at $230.
For BeInCrypto’s latest crypto market analysis, click here.
Top crypto platforms in the US | November 2023
Paybis
Paybis” target=”_blank”>No fees for 1st swap →
iTrustCapital
iTrustCapital” target=”_blank”>Crypto IRA →
Coinbase
Coinbase” target=”_blank”>$200 for sign up →
Uphold
Uphold” target=”_blank”>No withdrawal fee →
eToro
eToro” target=”_blank”>$10 for first deposit →
BYDFi
BYDFi” target=”_blank”>No KYC trading →
The post As Binance Launches Web3 Wallet, Is a $300 BNB Token Price Within Reach? appeared first on BeInCrypto.