The Axie Infinity (AXS) price has increased by 160% this year and reached a new yearly high of $11.05 today.
The price also broke out from important long-term diagonal and horizontal resistance levels.
Axie Infinity Breaks out From 700-Day Resistance
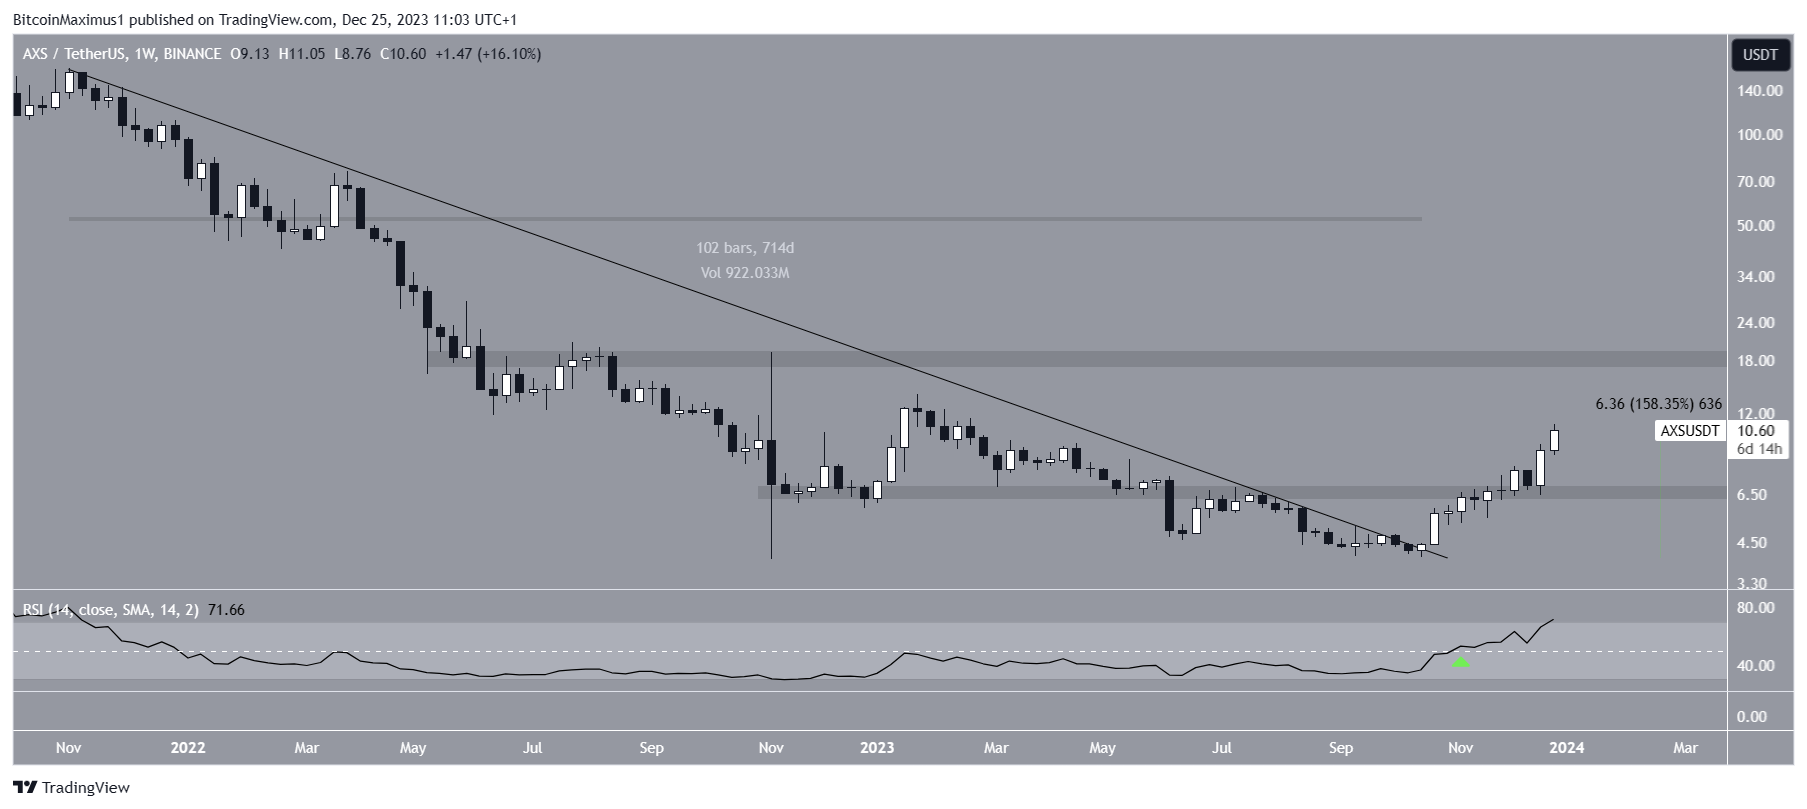
The AXS price has increased since October, when it broke out from a long-term descending resistance trend line. Before the breakout, the trend line had been in place for more than 700 days, specifically since the all-time high of November 2021.
The increase since the breakout has been swift, causing a reclaim of an important horizontal resistance area. The AXS price reached a new yearly high of $11.05 today. Since November 2023, AXS has increased by nearly 160%.
The Relative Strength Index (RSI) is a momentum indicator traders use to evaluate whether a market is overbought or oversold and whether to accumulate or sell an asset.
Readings above 50 and an upward trend suggest that bulls still have an advantage, while readings below 50 indicate the opposite.
The RSI is increasing and is above 50, both signs of a bullish trend. Interestingly, this is the first time the RSI crossed above 50 (green icon) since December 2021.
Read More: Axie Infinity (AXS) Explained for Beginners
AXS Price Prediction: Is This the Beginning of the Rally?
Utilizing the Elliott Wave theory, technical analysts examine long-term price patterns and investor psychology that recur to determine the direction of a trend.
The most likely wave count suggests that the AXS price is in wave three of a five-wave upward movement (black). Wave three is often the sharpest out of the bullish waves. Wave two was a running flat correction, a sign that momentum lies with the bulls.
Read More: 9 Best AI Crypto Trading Bots to Maximize Your Profits
Additionally, the daily RSI broke out from its bearish divergence trend line (green) and is increasing, both signs of a bullish trend.
The closest resistance area is 20% above the current price of $13. If wave three extends and reaches 1.61 times the length of wave one, Axie Infinity can reach the $17.20 resistance, 60% above the current price.
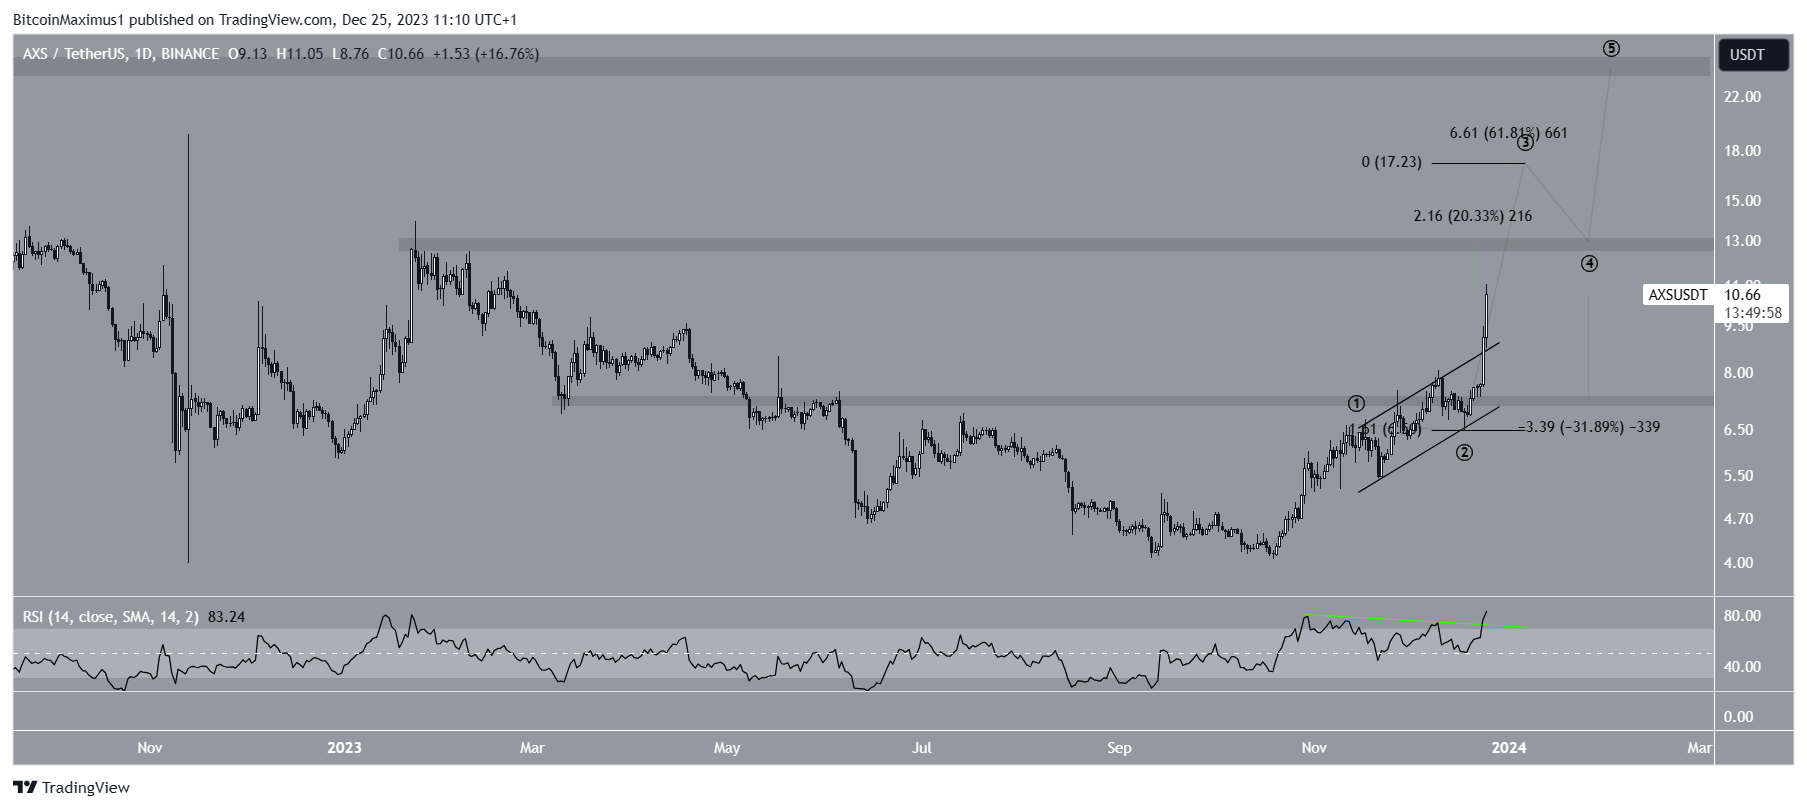
Despite this bullish AXS price prediction, failure to close above $13 can trigger a 30% drop to the closest support at $7.50.
For BeInCrypto’s latest crypto market analysis, click here.
Top crypto platforms | December 2023
![]()
Kraken
Kraken” target=”_blank”>Explore →
![]()
KuCoin
KuCoin” target=”_blank”>Explore →
![]()
BYDFi
BYDFi” target=”_blank”>Explore →
![]()
MEXC
MEXC” target=”_blank”>Explore →
Explore more
The post Axie Infinity (AXS) Breaks Through $10 Barrier – Has the Bull Run Begun? appeared first on BeInCrypto.