Bitcoin experienced a golden cross on September 8 after spending 293 days below its 200-day moving average over the preceding year. Binance Research examined this metric across 13 historical golden cross events to assess whether the length of such a reset correlates with the strength of subsequent recoveries.
A golden cross occurs when the 50-day moving average rises above the 200-day moving average. Binance's analysis categorized past crosses by the number of days Bitcoin closed below its 200-day average in the year prior to each event.
Deep Resets and Stronger Gains
The six golden crosses that followed at least 150 days below the trend line produced peak gains ranging from roughly 100% to 600% within the following year. In contrast, the six crosses that followed shallower resets showed more variation, with four of them peaking below 100%.
However, the relationship did not scale linearly. The strongest rallies occurred in February and May 2020, following just over 150 days below the trend. The historical period closest to Bitcoin's current 293-day reset was October 2015, which followed approximately 297 days below the average and peaked near 150% within a year.
Recent Signals and Current Conditions
A second long-term indicator emerged on September 20, when Bitcoin posted an $81,159 weekly close, marking its first close above the 50-week average since November 9, 2025.
Binance acknowledged significant limitations in its findings. The data reflects peak gains within a following year rather than returns from holding Bitcoin for a full 12-month period. The small sample size and overlapping data points constrain how reliably the history can predict future outcomes.
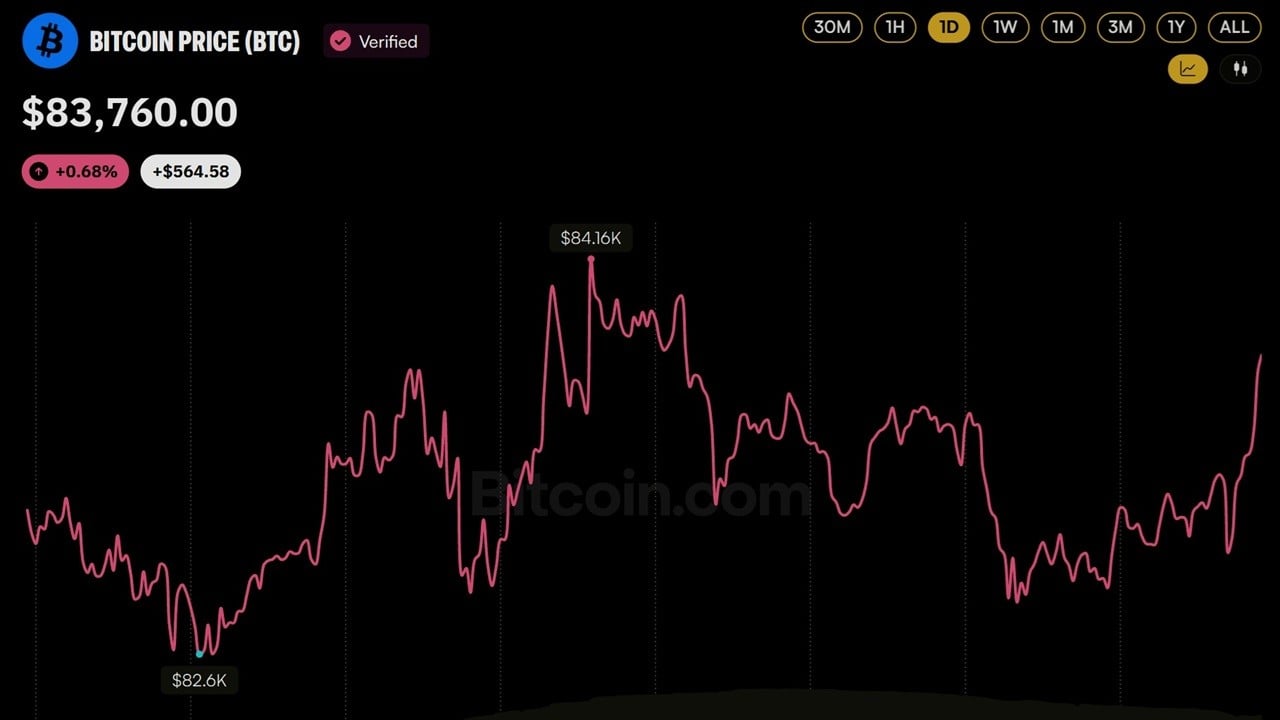
Current macroeconomic conditions present additional complexity. The US 10-year Treasury yield reached 5.17% by September 25, its highest level since 2007, coinciding with weak demand at a Treasury auction and business activity data hitting a 62-month high. These moves corresponded with a pullback in Bitcoin from above $86,000 to $83,175 at the time of reporting.
Spot Bitcoin exchange-traded fund inflows provided some counterbalance. US spot Bitcoin ETFs recorded $998.95 million in inflows on September 21, their largest daily inflow of 2026.
Binance suggested stronger confirmation of a sustainable recovery would emerge if Bitcoin maintains a position above its 50-week average through upcoming economic data releases, including the Personal Consumption Expenditures price index and payroll figures.