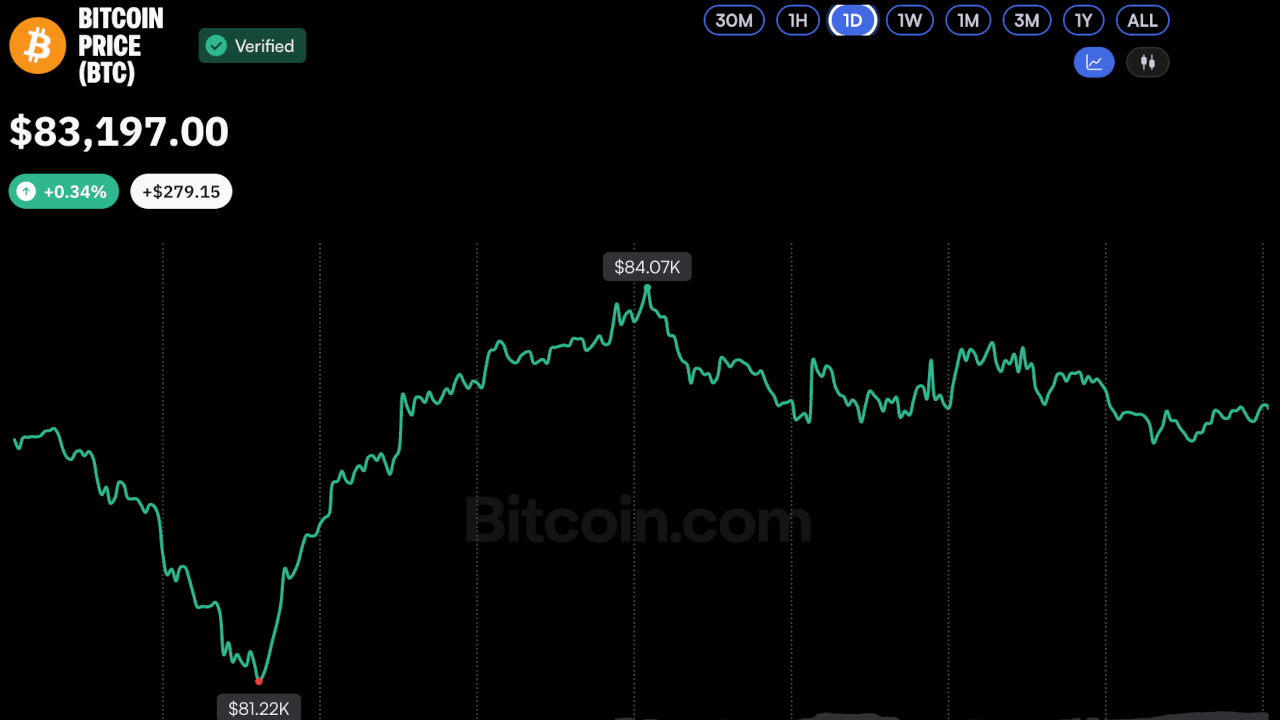
Bitcoin climbed 2.24% to $83,591.79 on Tuesday, reversing earlier losses to $80,953.41 and establishing a higher low than the $80,365.12 level that initiated its latest bounce.
The Crypto Fear and Greed Index, a sentiment gauge that incorporates momentum, volatility, options positioning, and social data, stands at 56—a neutral reading. The index has declined from an "extreme greed" peak of 82 recorded on August 26, suggesting that market euphoria from earlier in the year has cooled without triggering panic selling.
Key technical levels and trader outlook
Bitcoin reclaimed the Fibonacci "golden zone" between $81,847.57 and $82,305.50, an area where buyers typically defend in uptrends. The 50-day exponential moving average remains above the 200-day average, confirming an intact long-term uptrend according to technical analysts.
The Average Directional Index, which measures trend strength, reads 29.9—above the 25 threshold that confirms a trend. However, this represents a decline from 42.8 on October 7, indicating the uptrend is coasting rather than accelerating.
On prediction markets, traders assign 54% odds that Bitcoin falls to $80,000 in October and 45% odds it reaches $87,500.
Near-term catalysts
Bitcoin ETFs have experienced net outflows of $386.3 million in October. Wednesday's Consumer Price Index report, expected to show annual inflation rising to 3.6% from 3.4%, presents the next major test for the market. The Federal Reserve meets October 27-28. Oil headlines, Iran-related developments, Treasury yields, and daily ETF flows remain short-term factors to monitor.
A daily close above $84,245.88 would open upside to $86,644.19 and the $87,422.70 high. Support at $81,603.02 would bring resistance into play near $80,000, with further weakness potentially exposing $77,500.