 Price Approaches ,000 – Is This the Next Target Before Halving?")
Bitcoin (BTC) reached a new yearly high of $41,745 during this morning’s Asian session. The largest cryptocurrency closed its 7th bullish week in a row and continues its upward movement towards long-term resistance at $42,000.
Many technical indicators show that Bitcoin is already in overbought territory, and the $42,000 level could provide strong resistance. However, there are also signals that preceded previous bull markets in post-halving periods. Will the market not wait for halving this time, and will the upward trend of the BTC price continue?
Bitcoin (BTC) Reaches Yearly High and Long-Term Resistance
The price of BTC has been surging rapidly since mid-October 2023. In a 7-week period, Bitcoin increased from $27,000 to an area just below $42,000. This is an upward movement of 55%.
The weekly chart shows that Bitcoin is currently reaching a strong long-term resistance area (red line). It may act as a target for the current upward phase. This resistance marks the 0.5 Fib retracement of the downtrend from the all-time high (ATH) to the November 2022 cycle low. In addition, the $42,000 level is the historical ATH from January 2021 (blue circle).
Market traders use the Relative Strength Index (RSI) as a momentum indicator to identify overbought or oversold conditions. In addition, they decide whether to accumulate or sell assets based on it.
Readings above 50 and an uptrend indicate that the bulls still have the upper hand, while readings below 50 suggest the opposite.
The weekly RSI for Bitcoin is increasing and is at 81. Moreover, it has been in an overbought area for 6 weeks now. This would indicate an increasingly overheated market, which could signal an impending correction.
However, in an accelerating bull market, the RSI could be in bullish territory for many weeks, as it was in late 2020 and early 2021. It is worth mentioning that at that time, the RSI peaked at 95 when Bitcoin hit $42,000.
What Are Analysts Saying About Bitcoin?
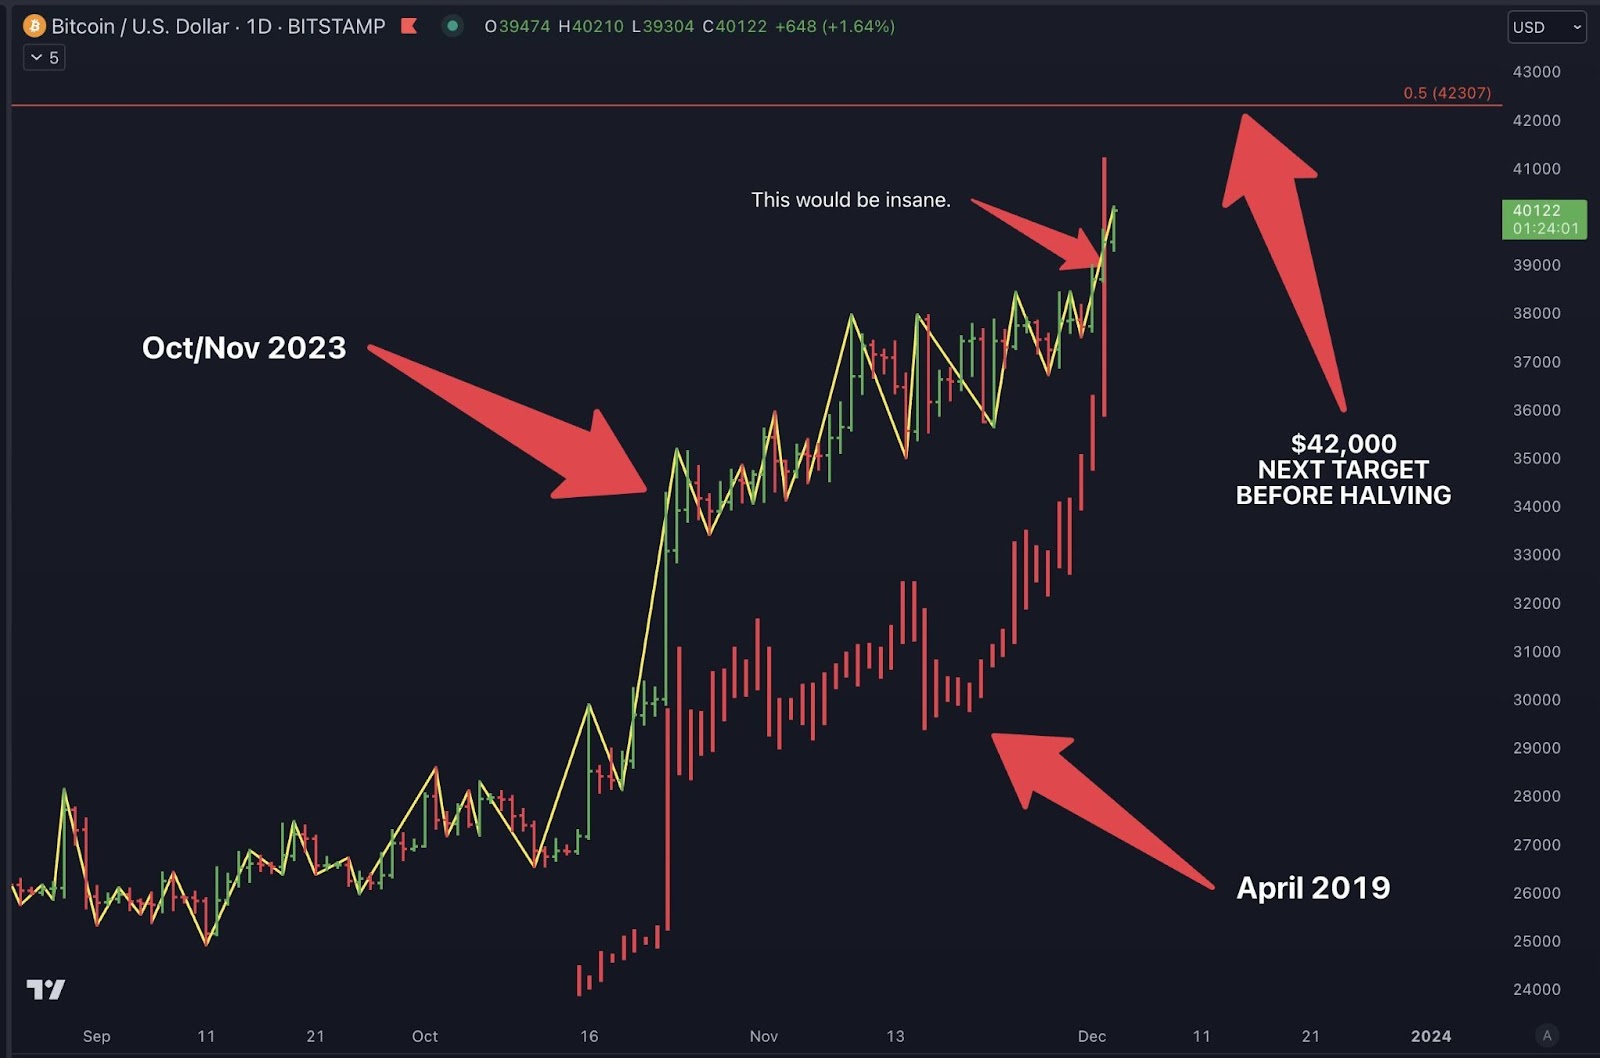
Analysts at X are divided about the future outlook for the BTC price. For example, @jasonpizzino also points out that the main area of resistance is now $42,000.
Moreover, he compares the current price action with the fractal of the parabolic movement of April 2019. In his opinion, the $42,000 level is a long-term target that will act as resistance before next year’s halving.
Another opinion is held by @TechDev_52, who published on X his analysis of the Vortex Indicator (VI). He pointed out that a rare signal (green) appeared on the monthly chart, which preceded all previous bull markets. After it flashed, Bitcoin would reach the top of the cycle over a period of 4 to 10 months.
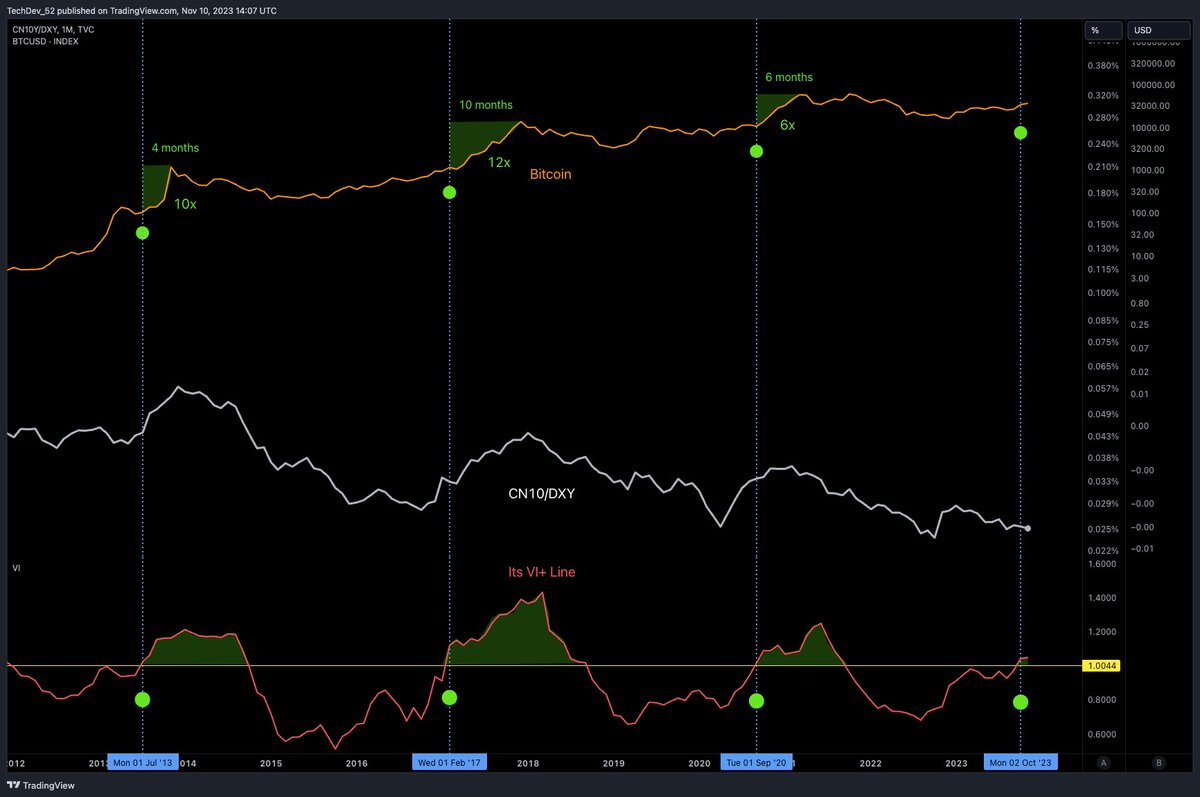
However, it appears that if this bullish signal turned out to be correct, the halving narrative would be shaken. All previous signals appeared after consecutive halving. Moreover, most market participants believe that the bull market in cryptocurrencies appears as a consequence of reducing the reward for BTC miners by half.
Read More: Top 9 Telegram Channels for Crypto Signals in 2023
However, if this time turned out to be different, then perhaps the significance of the upcoming halving will no longer be so fundamental. The analyst sums it up, stating:
“While most are waiting for the halving, liquidity is not.”
BTC Price Prediction: Is the Market Expecting a Correction?
The reaction to the $42,000 level will determine the further outlook of the BTC price. If, according to the above analyses, this area will be a strong resistance, a correction should be expected. The daily chart shows that the first target is the 0.382 Fib retracement of the recent upward movement at the $36,000 level.
Should this support fail to hold, Bitcoin could drop further to the $34,100-$32,400 range, corresponding to the 0.5-0.618 Fib levels. This move could lead to the validation of the July 2023 resistance as support (green line).
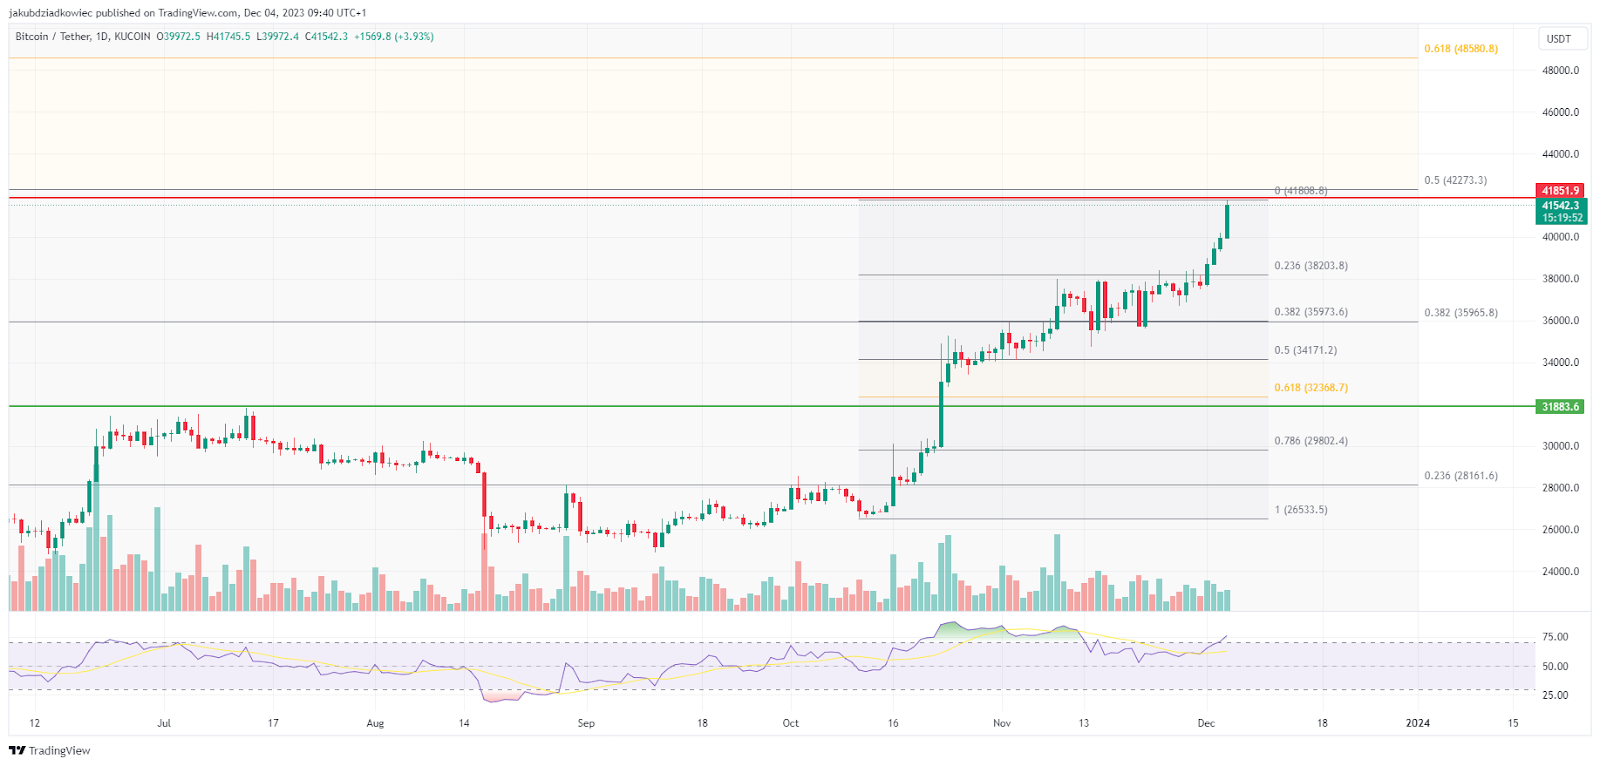
If, on the other hand, Bitcoin continues its uptrend and breaks through the key $42,000 level, the next target is $48,500. This area is marked by the long-term 0.618 Fib retracement measured from the ATH to the bottom of the cycle.
The RSI indicator, which has just returned to an overbought area above 70, suggests this possibility.
Read More: 9 Best AI Crypto Trading Bots to Maximize Your Profits
For BeInCrypto’s latest crypto market analysis, click here.
Top crypto platforms | December 2023
![]()
Kraken
Kraken” target=”_blank”>Explore →
![]()
BYDFi
BYDFi” target=”_blank”>Explore →
![]()
KuCoin
KuCoin” target=”_blank”>Explore →
![]()
Binance
Binance” target=”_blank”>Explore →
![]()
MEXC
MEXC” target=”_blank”>Explore →
Explore more
The post Bitcoin (BTC) Price Approaches $42,000 – Is This the Next Target Before Halving? appeared first on BeInCrypto.