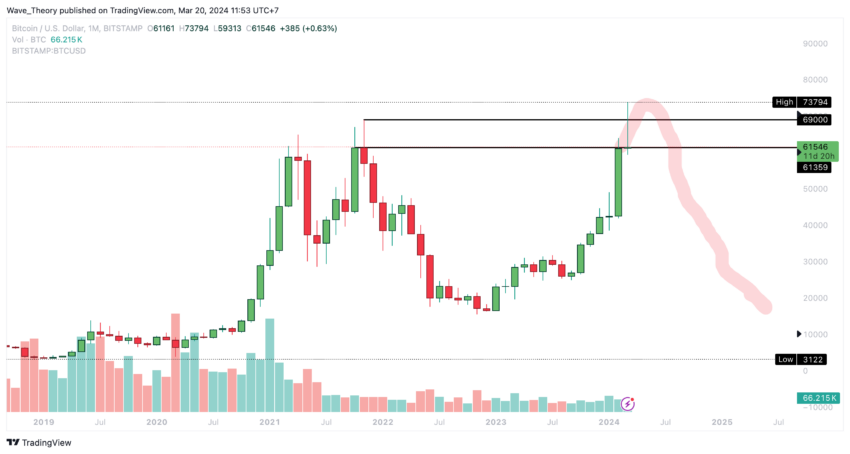
The Bitcoin price has nearly reached the correction target of $60,000, as previously forecasted when it was around $71,700.
The question now is whether it will remain at $60,000 or decline further.
Bitcoin Doomsday: Has BTC Already Hit its Peak?
Before delving into the analysis of the BTC price, it’s prudent to consider the worst-case scenario where Bitcoin might revert to its previous low of around $15,500.
However, this outcome seems less likely given the current circumstances. Let’s explore a more realistic scenario.
Bitcoin’s 17% Drop: Brace for More Downside?
The Bitcoin price currently sits 17% below its all-time high (ATH) of approximately $73,800, nearing the anticipated correction target of around $60,000. This aligns with the next significant Fibonacci support at approximately $60,270, where a bullish bounce could potentially resume the upward trajectory.
However, in a more severe correction scenario, Bitcoin might target the following significant Fib support levels at around $51,500 and $36,000. As long as Bitcoin remains above $36,000, the bullish trend remains intact.
Read More: How To Get Paid in Bitcoin (BTC): Everything You Need To Know
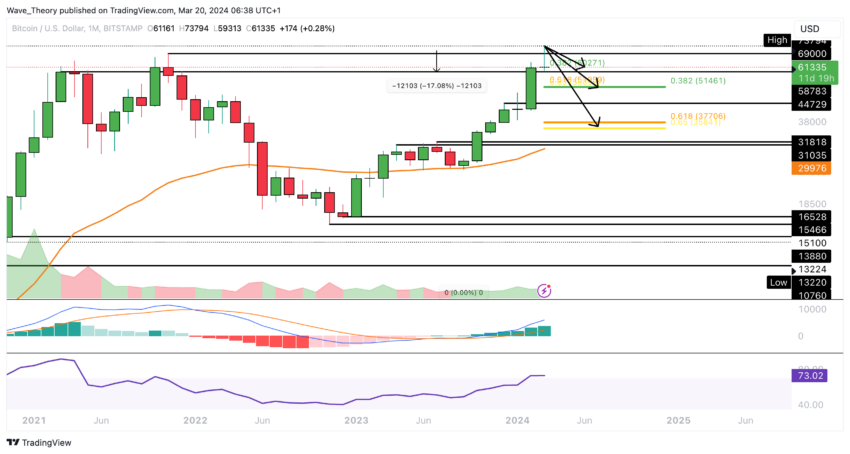
These levels provide opportunities for bullish rebounds, though the extent of the correction’s final destination remains uncertain. Nonetheless, monthly chart indicators, such as the Moving Average Convergence Divergence (MACD) histogram showing an upward trend and the MACD lines remaining bullishly crossed alongside a neutral Relative Strength Index (RSI), do not yet signal bearish sentiment.
Is Bitcoin Heading for Another 15% Drop?
If Bitcoin rebounds from the 0.382 Fib support around $60,270, it could encounter resistance at approximately $65,500 and $69,000. Breaking the golden ratio at $69,000 could signify the end of the correction phase and pave the way for a new all-time high (ATH).
Conversely, if Bitcoin breaks below the 0.382 Fib support, it may face further downside potential, targeting support at around $51,500.
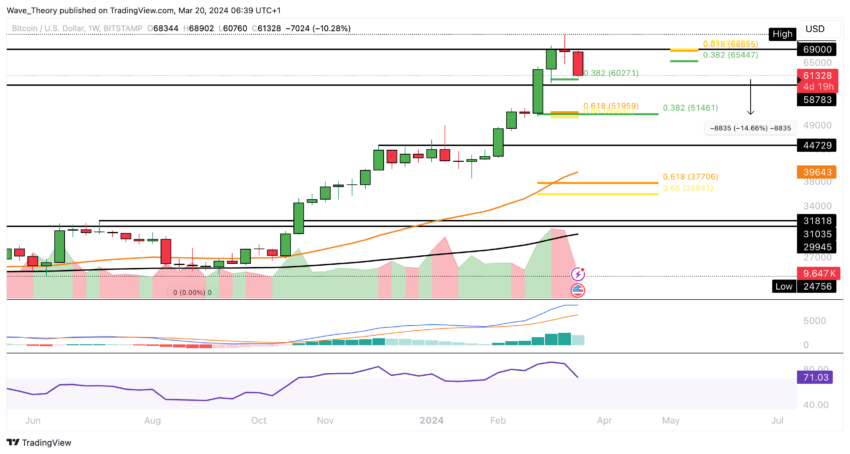
Despite the MACD histogram showing a bearish trend and the RSI being in overbought regions, the MACD lines remain bullishly crossed, and the golden crossover in the weekly chart suggests the medium-term trend remains bullish.
What If Bitcoin Breaks Through Fib Supports?
In the daily chart, Bitcoin’s trend remains bullish in the short to medium term, supported by a golden crossover of the EMAs. However, bearish signals are observed with the MACD lines crossing downwards and the MACD histogram showing a bearish trend despite the RSI being in neutral territory.
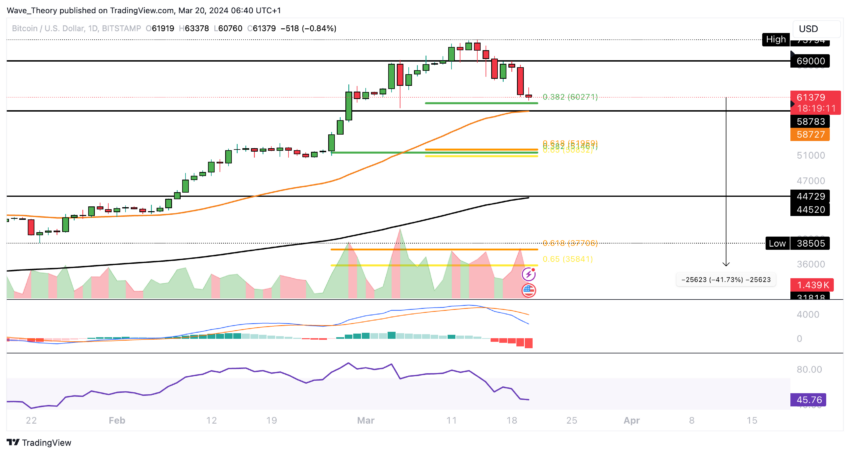
Bitcoin’s price is currently supported by the 50-day EMA around $58,783, with a potential rebound zone between $58,783 and $62,270. Failure to hold these levels could lead to a significant correction, with potential downside targets at around $36,000, supported by the 200-day EMA at approximately $44,500.
Bitcoin 4H RSI: Anticipating Bullish Divergence
In the 4-hour chart, bearish signals persist for Bitcoin as the MACD lines are crossed downwards and the MACD histogram trends lower. The RSI is approaching oversold territory but does not indicate a bullish divergence.
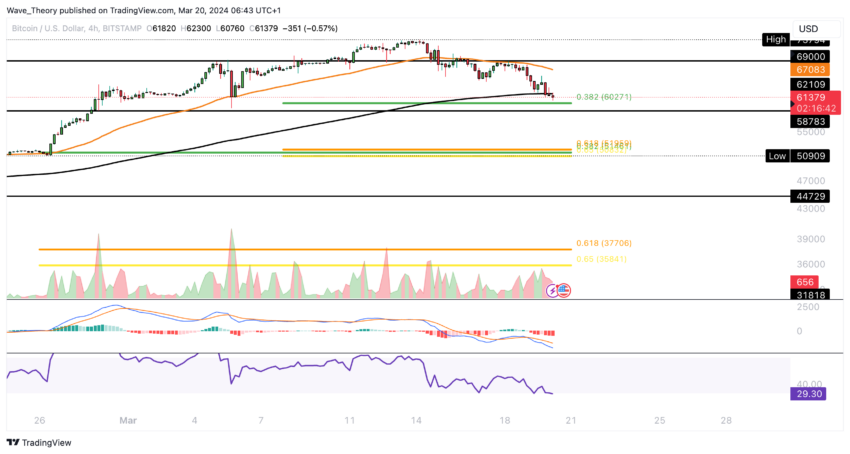
However, the EMAs maintain a golden crossover, suggesting a continued short-term bullish trend.
Bitcoin Dominance: Mixed Signals for Bulls and Bears
In the weekly chart, Bitcoin dominance shows mixed signals, with the RSI indicating a bearish divergence and bearishly crossed MACD lines. However, the MACD histogram fluctuates between bullish and bearish movements.
Read More: Bitcoin Price Prediction 2024/2025/2030
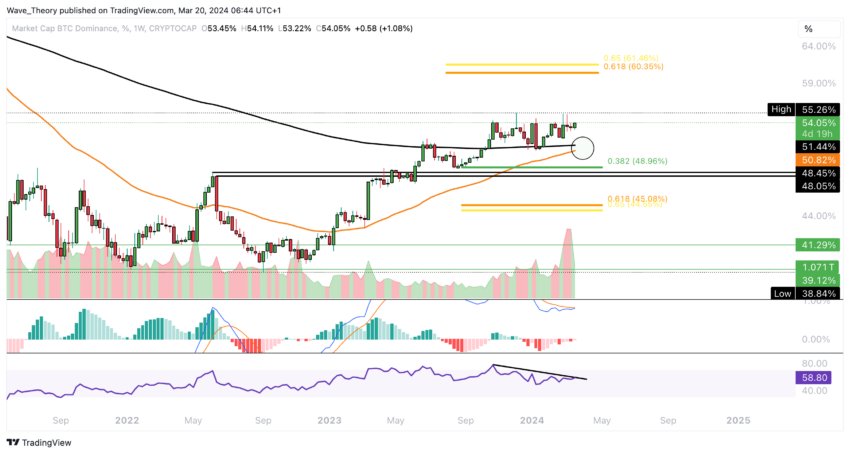
Additionally, the EMAs are nearing a bullish crossover, which would confirm a bullish trend in the medium term. Resistance for Bitcoin dominance is significant at around 60.5%, while the next significant Fib resistance is around 49% on the downside.
The post Bitcoin (BTC) Price Forecast: Correction Over, Bull Run Ahead? appeared first on BeInCrypto.