 Price Stalls at ,000 – Where Does It Go From Here?")
The Bitcoin (BTC) price increase stalled last week, failing to cause a close above $28,000.
Bitcoin has now fallen since October 2, when it reached a high of $28,580. It is trading in the middle of a horizontal range. Where does it go from here?
Bitcoin Price Increase Stalls at $28,000
The analysis of the weekly timeframe reveals that Bitcoin’s price has risen since the week starting September 11th. This upward movement has confirmed the $25,300 horizontal level as a reliable support.
The BTC price increase gained momentum two weeks ago, forming a bullish engulfing candlestick pattern. This specific candlestick pattern erases all losses from the previous period, indicating a positive outlook for future price trends.
Check out the Best Crypto Sign-Up Bonuses in 2023
But, Bitcoin could not sustain the increase last week, creating a weekly candlestick with wicks on each side, considered a sign of indecision.
The BTC price now trades in the middle of a horizontal range between $25,300 and $30,500.
The weekly RSI is undetermined. With the RSI as a momentum indicator, traders can determine whether a market is overbought or oversold and decide whether to accumulate or sell an asset.
Bulls have an advantage if the RSI reading is above 50 and the trend is upward, but if the reading is below 50, the opposite is true.
The RSI has traded very close to the 50 trendline since August (green circle), indicating an undetermined trend.
BTC Price Prediction: Will Deviation Lead to Retest of Range Low?
The daily timeframe technical analysis for the Bitcoin price is leaning bearish. The main reason for this is the decrease that began on October 2 (red icon), when Bitcoin created a bearish candlestick (red icon) after seemingly moving above $28,000 (red line).
The ensuing decrease confirmed that the previous move was only a deviation, not a legitimate breakout.
Stay ahead in the game with Bitcoin (BTC) price forecasts.
While the BTC price action is bearish, the RSI offers hope that the increase will continue. This is because the bullish divergence trendline (green) that preceded the entire increase is still intact. Also, the indicator is above 50.
If the ongoing rejection continues, BTC can fall by another 7% and reach the descending resistance trendline at $26,000.
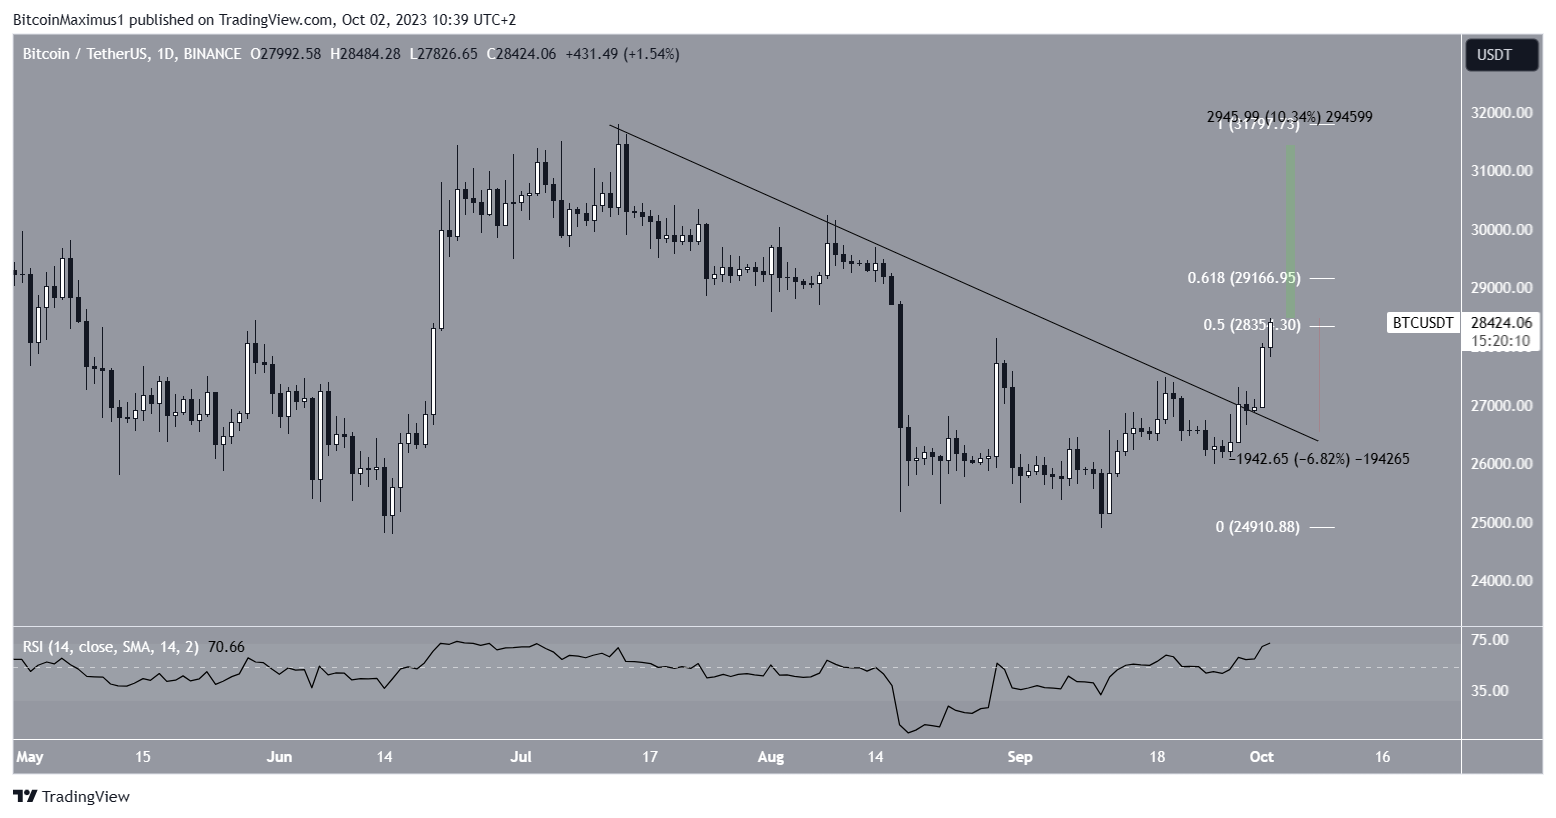
Despite this bearish Bitcoin price prediction, a daily close above the $28,000 resistance area will likely lead to a 9.50% increase to the next resistance at $30,500.
Learn to trade: How to Use RSI Indicator in Crypto Trading.
For BeInCrypto’s latest crypto market analysis, click here.
The post Bitcoin (BTC) Price Stalls at $28,000 – Where Does It Go From Here? appeared first on BeInCrypto.