Bitcoin analyst Frank Cappelleri has identified technical similarities between Bitcoin's current chart structure and the setup that preceded a significant rally in 2022 and 2023, when the cryptocurrency recovered from a roughly 70% decline.
Speaking on CNBC, Cappelleri compared Bitcoin's recent 54% decline with the steeper 70% drop from the earlier period. He characterized the current pattern as bullish, noting that the previous decline eventually led to a substantial breakout. "Bitcoin can really rally," he said, referencing the 400% gain achieved in that earlier cycle.
Cappelleri was careful to clarify that he is not projecting an equivalent return this time. "Not calling for that," he stated, explaining instead that he sees "a very similar foundation" that could eventually drive Bitcoin to new highs. He emphasized Bitcoin's historical responsiveness to technical signals as support for his analysis.
Current Market Conditions
At the time of the analyst's comments, Bitcoin was trading near $84,000. The cryptocurrency has gained approximately 1% over the previous 24 hours and roughly 10% over the past 14 days, though it remains about 27% below its level from a year prior. Bitcoin posted a third-quarter gain of approximately 42%, marking its best Q3 performance since 2017.
Supporting and Conflicting Signals
Several metrics suggest a mixed technical picture. Data from Santiment indicates that wallets holding between 10,000 and 10,000 BTC accumulated 41,025 BTC over a 10-day period, bringing their combined balance to 13.64 million BTC. Historically, such accumulation by larger holders has preceded stronger market conditions.
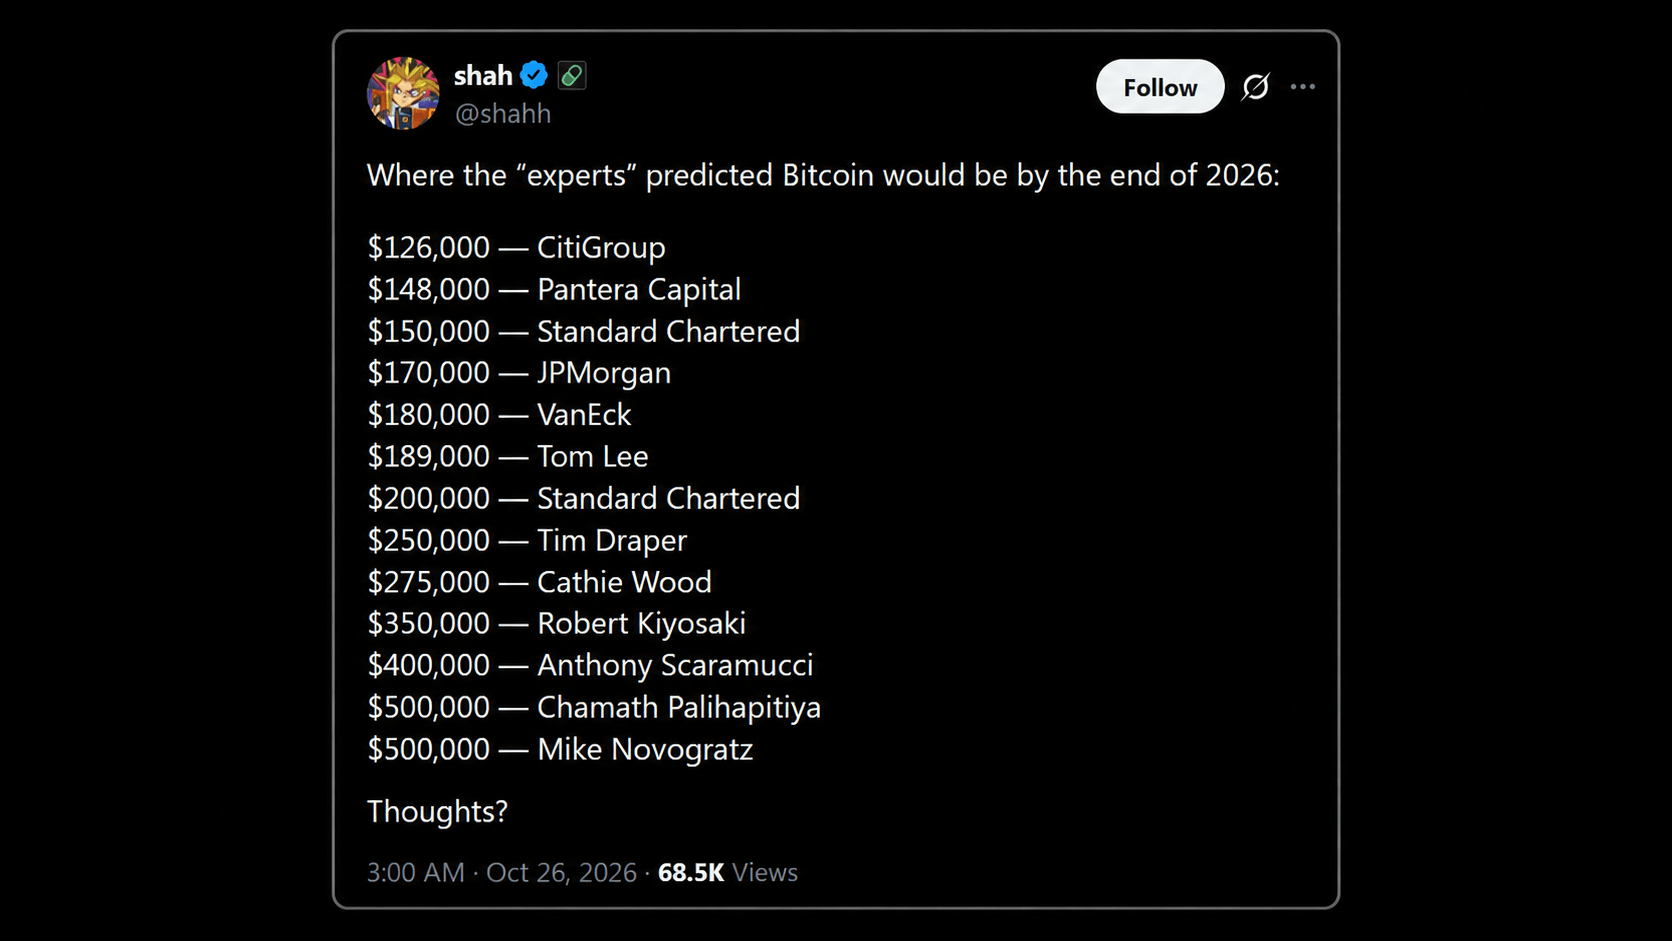
BIT Research determined that the bear market ended after Bitcoin held above $62,900 in late July. The firm estimated the True Market Mean, representing the average holder cost basis, at approximately $76,900, potentially reducing selling pressure. BIT Research outlined a bullish scenario ranging from $185,000 to $215,000, while noting that timing and path remain uncertain.
However, other analysts point to conflicting signals. Ali Martinez noted that Bitcoin has declined following each of the four previous US midterm elections, with losses ranging from 27% to 72%, introducing additional uncertainty as November approaches.