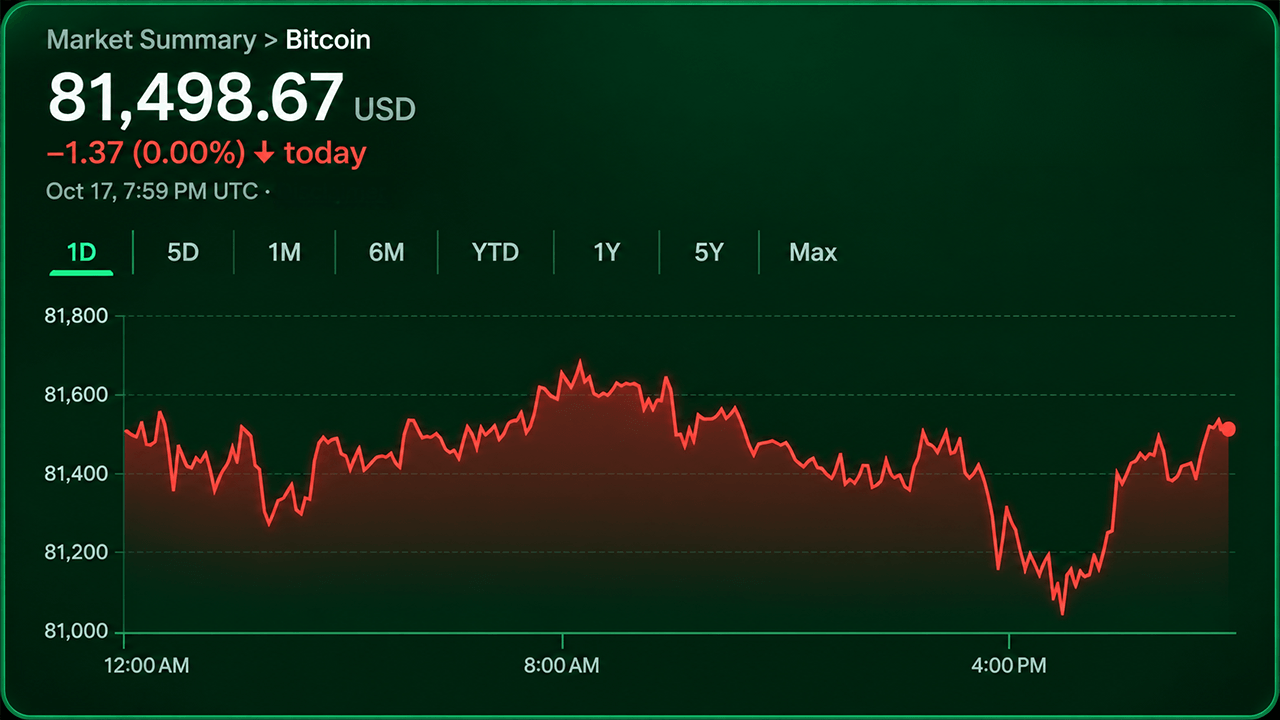
Bitcoin traded near $81,500 on October 17, 2026, caught between competing technical forces. The cryptocurrency's market capitalization stood at approximately $1.639 trillion with $13.967 billion in daily trading volume, as buyers and sellers fought for directional control within a narrow range.
The 24-hour price range stretched from $81,108.80 to $81,733.01, confining bitcoin to a consolidation pattern that left traders uncertain whether the price action signaled recovery or a temporary pause before further decline.
Technical Picture Divided on Multiple Timeframes
Shorter-term moving averages favored sellers, with bitcoin trading beneath its 10-period exponential moving average at $82,343 and 20-period simple moving average at $83,405. However, longer-term averages remained bullish, including the 50-period exponential moving average at $80,416 and both the 100- and 200-period averages, which retained upward classifications.
On the hourly chart, successive higher lows suggested buyers were attempting to establish support around $81,000, though declining trading volume indicated the recovery lacked convincing participation. Immediate resistance extended between $81,700 and $82,000.
The four-hour chart showed bitcoin consolidating after rejection near $84,254. Price action remained concentrated around the $81,000 to $81,700 zone, with order-book observations placing additional bids toward $80,000 and overhead offers extending higher.
Momentum Indicators Remain Neutral
Oscillators provided little evidence of decisive momentum shift. The relative strength index (RSI) stood at 46, indicating neither overbought nor oversold conditions. The Stochastic registered 27, while the commodity channel index (CCI) sat at negative 116 and the average directional index (ADX) read 24. The moving average convergence divergence (MACD) level of 80 carried a bearish signal, contrasting with positive classifications for momentum and bull bear power. Eight neutral readings left directional conviction conspicuously absent.
Key Support and Resistance Levels
Support clustered around $81,000, with a break below $80,714 potentially exposing $79,694. The $80,000 region served as both a psychological boundary and technical reference point. Resistance extended toward $82,500, with the $83,000 region presenting another obstacle for recovery. The $84,254 level marked a meaningful resistance barrier on the daily chart.