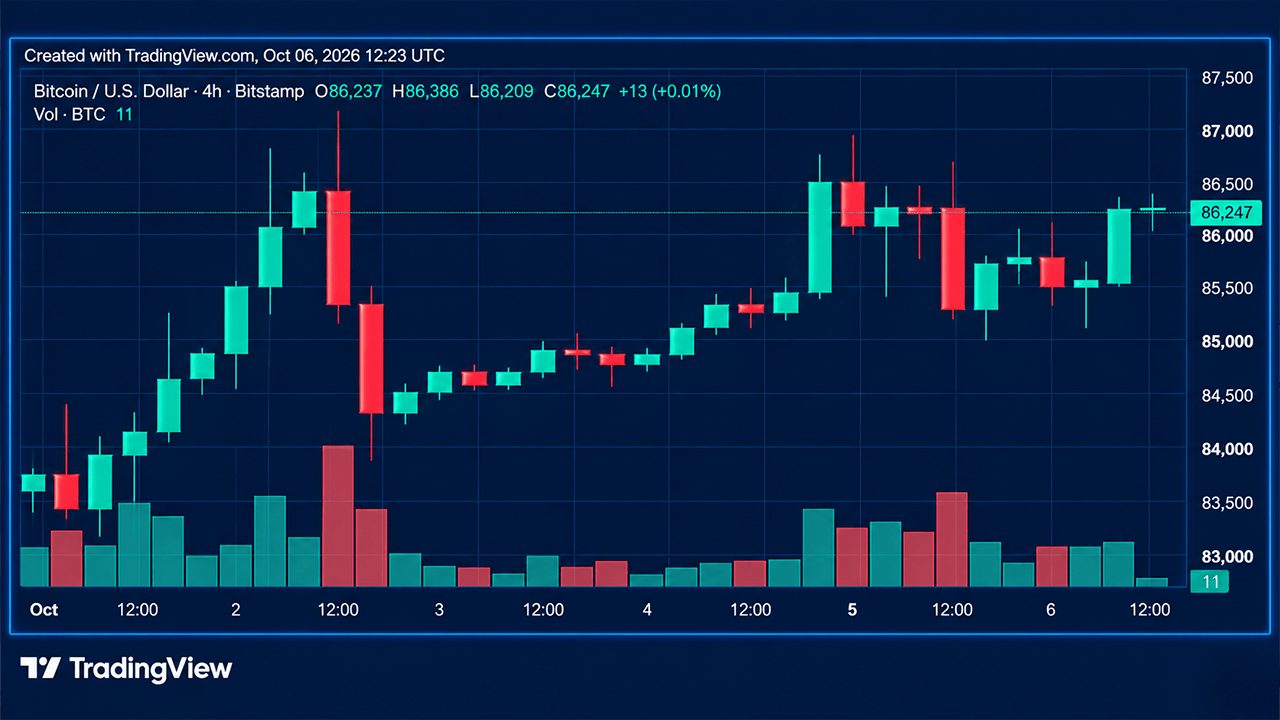
Bitcoin is testing resistance around $87,000 to $87,374 on Tuesday morning, Oct. 6, trading near $86,256 as bulls attempt to break through a repeated ceiling. The broader technical structure favors buyers, though oscillators show limited enthusiasm for a clean breakout.
The daily and 4-hour timeframes remain constructive, supported by 13 bullish moving averages out of 15 readings. The 10-period exponential moving average stands at $84,969, while the 50-period sits at $79,423. Longer-term averages, including the 100-period and 200-period measures, remain below current price levels, indicating sustained upward structure.
Technical Barriers and Support Levels
A break above $87,374 would confirm a fresh range high and open a path toward the $89,650 Fibonacci resistance level. Conversely, support around $85,900 to $86,000 marks the first line to watch if bitcoin retreats, followed by $85,000.
The cryptocurrency has traded largely between approximately $82,500 and $87,400 following a Sept. 18 low near $75,600. The Sept. 29-30 retreat established a higher low around $82,500, preserving the bullish structure of higher highs and higher lows intact on the daily timeframe.
Oscillators Send Mixed Messages
Daily oscillators present a more cautious picture than price structure alone. The relative strength index (RSI) sits at 66, while the Stochastic, commodity channel index (CCI), average directional index (ADX), Awesome oscillator (AO), and several others remain neutral. The average directional index at 44 points to a strong prevailing trend despite oscillator hesitation.
Momentum is bullish at 1,835, though the moving average convergence divergence (MACD) is bearish at 1,994. Volume has remained steady rather than expanding into the latest test of resistance.
Potential Outcomes
A daily close below $82,500 would break the higher-low structure supporting the advance and hand bears considerably more control. A deeper retreat through $83,500 would weaken the short-term structure and expose important support levels.