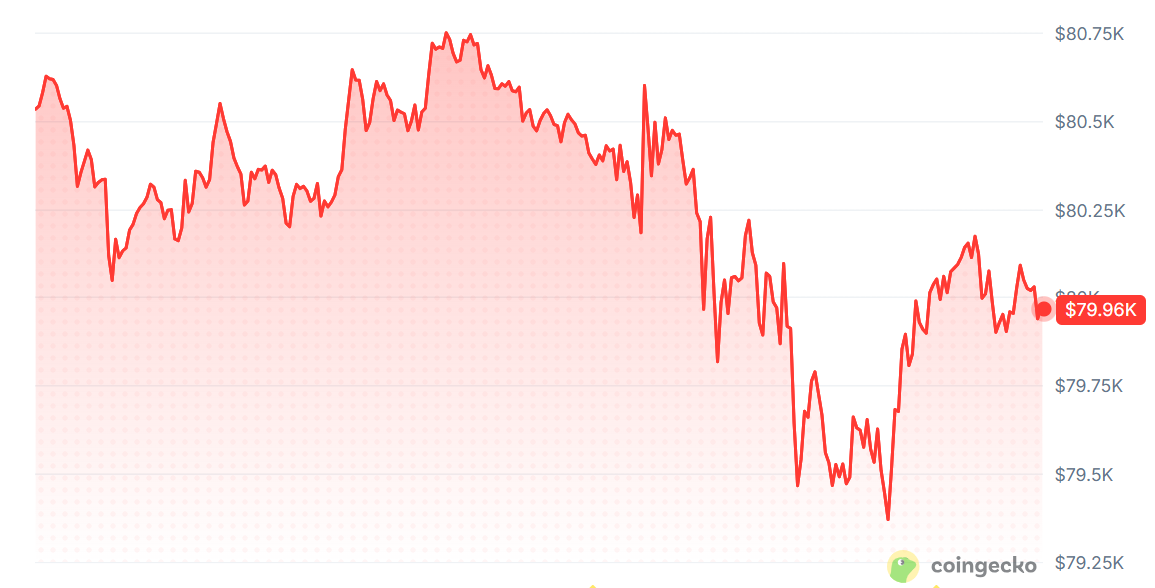
Bitcoin traded at $79,757.25 on October 26, down 0.74% over 24 hours and 3.22% across the past week, according to CoinGecko data. Daily trading volume reached $18.3 billion as analysts monitored key technical levels and liquidation patterns.
Analyst Ali Charts identified a breakdown below a rising parallel channel on the four-hour chart, suggesting the market's earlier upward structure has weakened. He set $82,000 as a critical resistance level and $72,500—approximately 9.1% below current prices—as a potential buying zone if the correction continues.
Liquidation patterns suggest volatile trading ahead. That Martini Guy's one-week heatmap showed a large liquidity cluster just above $81,000, with another concentration around $78,500–$79,000. A move toward $82,000 could accelerate if rising prices trigger short liquidations, forcing leveraged bearish positions to close and creating upward pressure. Conversely, losing the $79,000 area would bring lower liquidity into focus.
CoinAnk's three-day heatmap confirmed similar arrangements, with dense overhead exposure at $81,500–$82,000 and lower concentration at $78,500–$79,000. Recent price declines have cleared some liquidation clusters from the middle range, leaving traders monitoring the remaining levels for directional clues.
Bitcoin's near-term test centers on reclaiming $81,000 and challenging $82,000 resistance while defending $79,000 support. Analysts cautioned that liquidation levels do not guarantee price reversals and that Ali Charts' $72,500 target represents a downside scenario rather than an established destination.