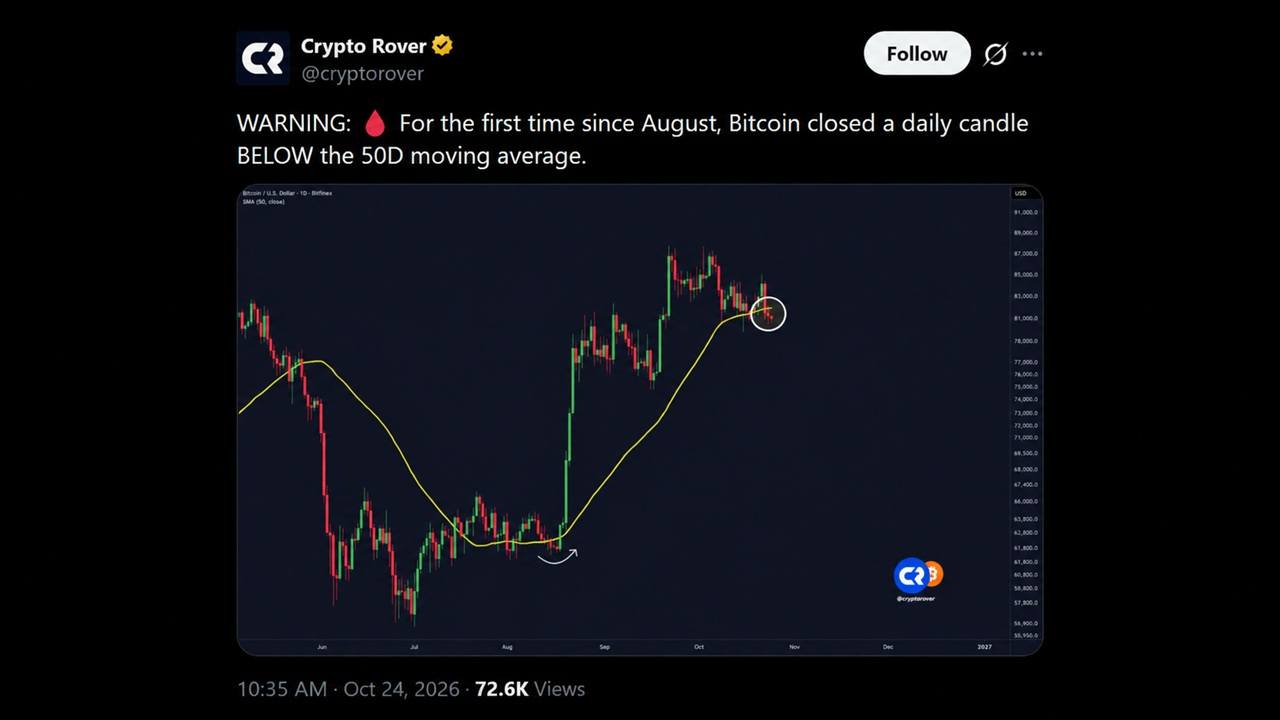
Bitcoin closed a daily candle below its 50-day moving average on October 24 for the first time since August, marking a technical breakdown that has historically signaled weakness in the market. The cryptocurrency slipped to approximately $80,698, falling below the 50-day average near $81,784.
The decline coincided with significant liquidations across cryptocurrency markets. Data showed $318 million in long positions were wiped out in 24 hours, while broader liquidation tracking recorded 175,527 traders liquidated for a combined $495.74 million.
Spot bitcoin exchange-traded funds also saw substantial outflows. U.S. spot bitcoin ETFs logged their biggest outflow since June on Thursday, a $635 million exit, with additional sales of $137.94 million by ETF issuers on Friday.
Geopolitical Pressure and Market Conditions
Market sentiment deteriorated following geopolitical comments, with crude oil prices climbing toward $120 a barrel. The broader equity market declined, with the Dow falling 652 points on Friday and nearly three out of four S&P 500 stocks closing in the red. Analysts estimated that $140 billion was wiped from the total crypto market cap over the week.
Technical Levels and Upcoming Tests
The 50-day moving average, which had previously acted as support for roughly two months, is now positioned approximately $1,000 above current price levels. Analyst commentary highlighted that the next 10 days could prove critical, with the Federal Open Market Committee decision scheduled for October 28 and a personal consumption expenditures inflation reading due October 29.
While some traders reported adding to existing positions in what they described as a buy zone, momentum gauges have cooled. The Bitcoin Bull Score Index recently declined from 80 to 60, indicating a shift in market sentiment.