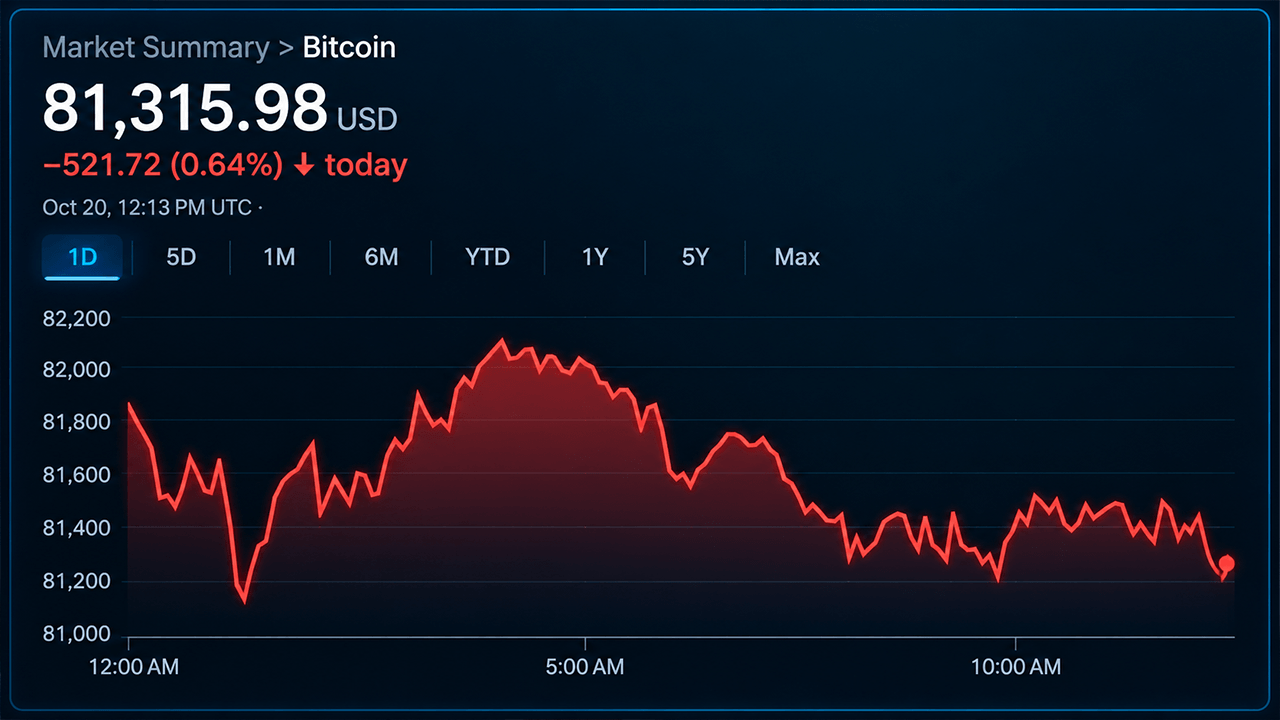
Bitcoin's price remained contested near $81,392 on October 20, caught between short-term selling pressure and technical support levels that have yet to fully deteriorate. The $81,100 level emerged as immediate support, with resistance positioned at $82,000 to $83,300.
Bitfire Research highlighted macroeconomic headwinds complicating the recovery outlook. September inflation data showed a 3.7% annual increase in consumer prices, while a roughly 90% probability of a December Federal Reserve rate hike loomed. U.S. spot bitcoin exchange-traded funds recorded approximately $228 million in weekly net outflows, and a negative Coinbase premium suggested weakening domestic demand.
Technical Structure Under Pressure
On the one-hour chart, bitcoin established lower highs after reaching $83,062, with the $81,900 to $82,000 corridor presenting the first meaningful obstacle for buyers. Declining trading volume suggested participation was thinning rather than signaling accumulation.
The four-hour timeframe showed bitcoin's technical structure remaining neutral to bearish, with repeated failures around $82,500 to $83,000. Buyers had defended the $80,500 to $81,000 demand region without translating efforts into a convincing directional reversal.
On the daily chart, bitcoin continued consolidating beneath its previous $87,374 high, with successive lower highs reflecting persistent selling pressure. Bitfire identified $82,500 as significant resistance, followed by the 20-day Bollinger Bands midpoint near $83,300, with critical downside support around $79,800.
Oscillators Signal Weakness
Technical indicators tilted toward sellers. The relative strength index stood at 46.24, while the Stochastic registered 30.61. The commodity channel index read negative 78.90, and momentum showed weakness at negative 1,515.88. The moving average convergence divergence registered negative 82.32.
Moving averages revealed bitcoin's technical contradiction. The 10-period and 20-period exponential moving averages remained overhead, yet the 50-period, 100-period, and 200-period exponential moving averages retained bullish classifications, with the 50-period simple moving average at $81,538 adding another nearby obstacle.
Bitfire Research cautioned that continued ETF outflows and weak technical indicators suggested spot demand had yet to recover decisively, with the Federal Reserve's October 28 policy decision approaching and limited room for complacency.