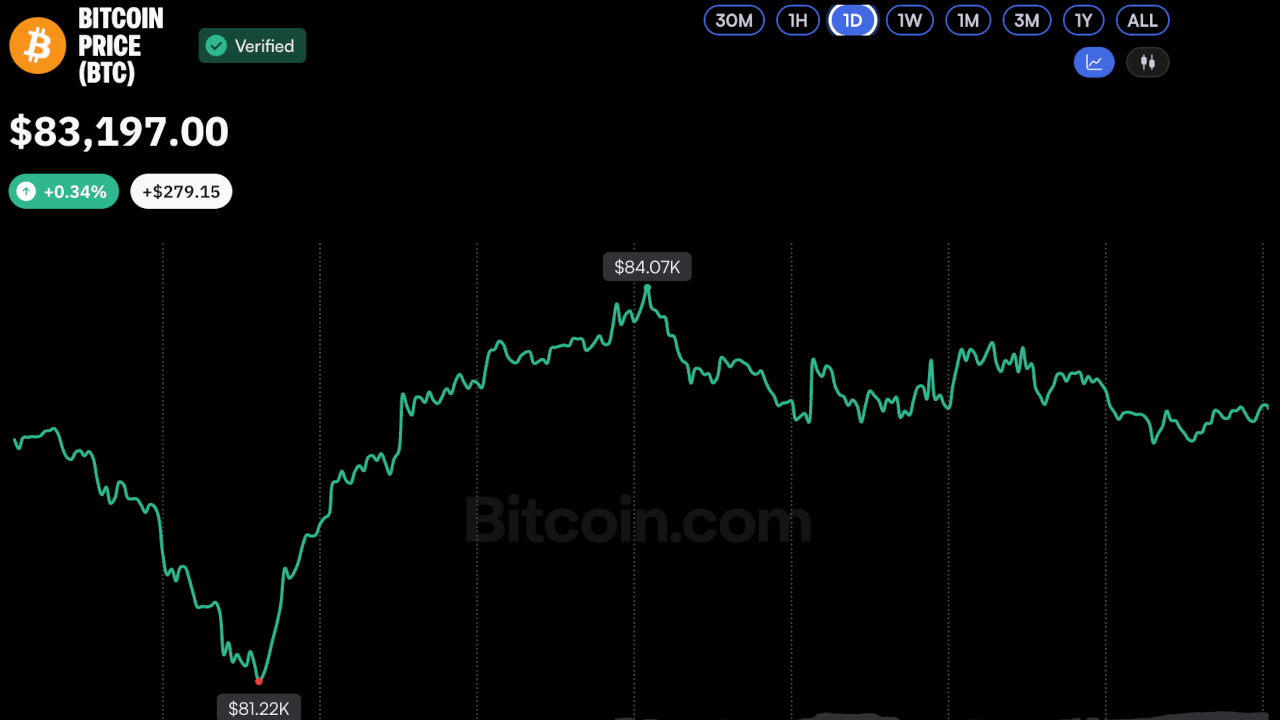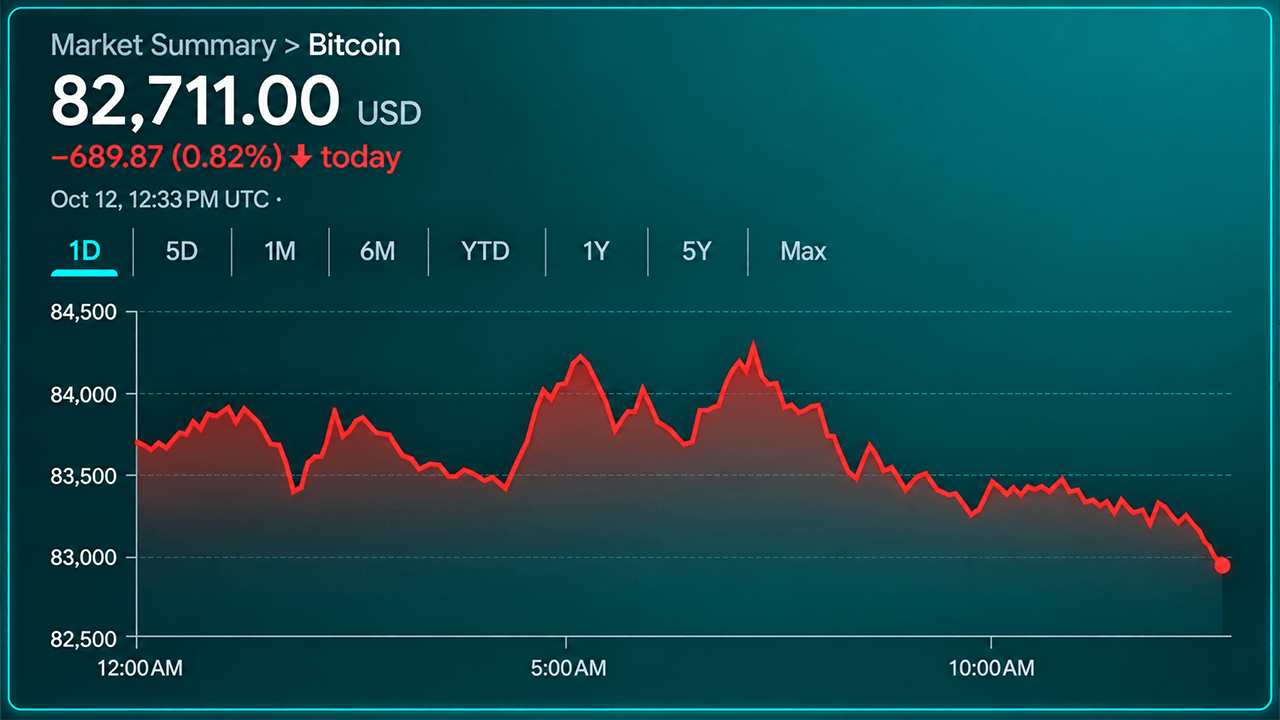
Bitcoin's price hovered near $83,000 on Monday, October 12, 2026, caught between bullish support from longer-term technical levels and bearish pressure from repeated failures to sustain gains above $84,000. With a market capitalization near $1.673 trillion and approximately $23 billion in daily trading volume, the cryptocurrency traded within a 24-hour range of $82,550 to $84,231.
Technical Stalemate Across Multiple Timeframes
Short-term charts reflected the market's indecision. The one-hour chart showed bitcoin struggling after retreating from a local high of $84,254, with successive lower highs and bearish candles pushing the price toward $83,000. Immediate support rested between $82,700 and $83,000, while resistance appeared near $83,500 followed by $84,000.
The four-hour chart presented a similar picture, with bitcoin recovering from $80,308 only to encounter repeated resistance between $83,800 and $84,000. Recent bearish candles suggested the recovery had lost momentum, though the market had not established a decisive downward trend. Key support held between $82,500 and $82,800, with $84,500 and $85,000 forming potential targets above $84,000.
On the daily chart, bitcoin remained above September's $74,913 low but below its more recent $87,374 peak. The cryptocurrency had retreated from approximately $86,500 toward $80,000 before staging a recovery that struggled to gain traction. The $80,000 to $81,000 region represented substantial support, while $84,000 to $85,000 formed the immediate resistance corridor.
Oscillators and Moving Averages Paint Divided Picture
Momentum indicators reinforced the neutral assessment. Eight oscillators registered neutral readings, two negative, and one positive signal. The relative strength index stood at 51, indicating balanced momentum, while the Stochastic index read 42 and the commodity channel index registered minus 61. The average directional index at 32 suggested an established trend without clearly identifying its direction, while the moving average convergence divergence carried a negative signal.
Moving averages on the daily chart offered a more encouraging intermediate-term perspective, with nine positive readings against five negative and one neutral. Bitcoin traded near its 20-period exponential moving average at $83,231, with the 10-period EMA at $83,509 and 20-period simple moving average at $84,071 presenting nearby obstacles. Longer-term support remained substantial at the 50-period EMA of $80,136 and 200-period SMA of $72,052, suggesting the broader recovery remained intact despite short-term hesitation.
Support and Resistance Levels
The immediate battleground centered on the $82,500 to $84,000 corridor. A daily close above $85,000 would strengthen the bullish case and place $86,500 and $87,374 within reach. Conversely, losing $80,000 would expose $78,000 and potentially $74,913, while a breakdown beneath $82,500 would shift attention toward $81,500 and the $80,308 swing low.