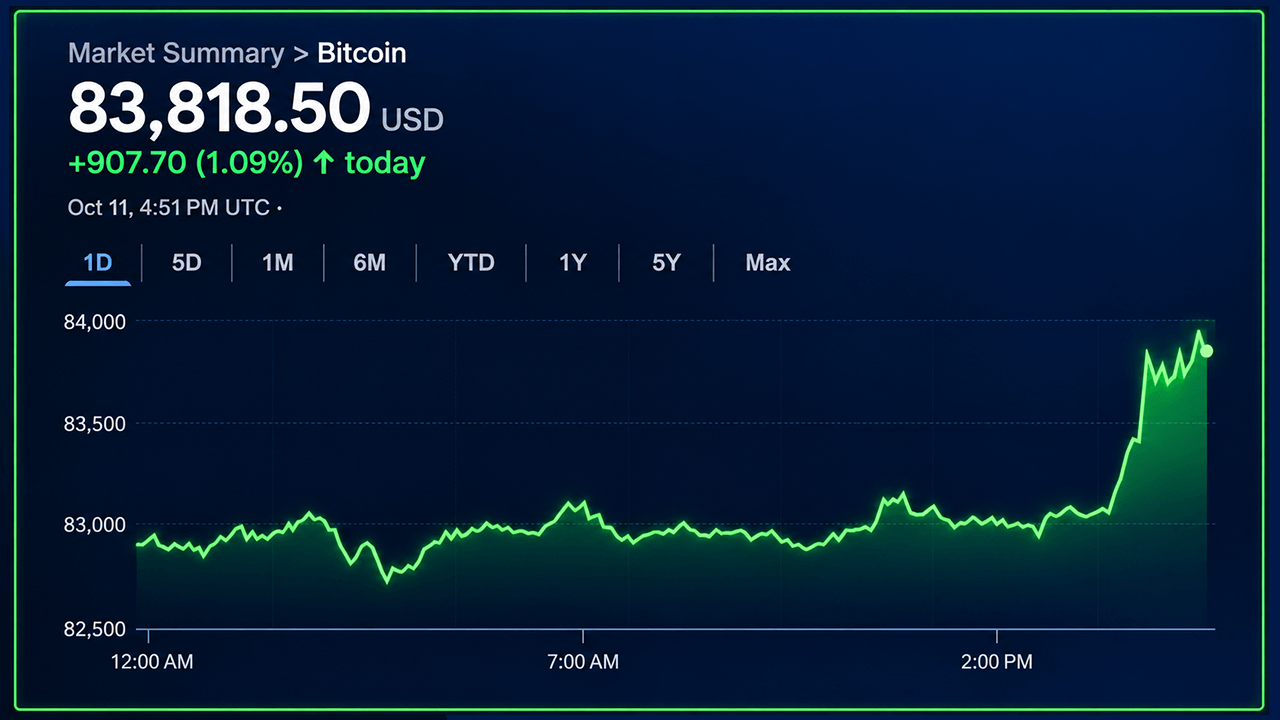
Bitcoin is trading near $83,770 on October 11, 2026, with a market capitalization of $1.683 trillion after advancing 0.9% over the past 24 hours. The leading cryptocurrency has recovered from a recent low of $80,308, but continues to face resistance in the $83,900 to $84,200 range that has prevented a sustained move toward $84,000.
Technical Picture Shows Mixed Signals
Bitcoin's price action reveals a technical contradiction: the cryptocurrency trades above its 10-period and 20-period exponential moving averages but remains below the corresponding simple moving averages at higher levels. This tug-of-war between different moving average types reflects uncertainty about the strength of the current recovery.
The one-hour chart shows bitcoin consolidating between $83,700 and $83,800 after breaking away from an earlier trading range near $83,000. Resistance between $83,900 and $84,200 remains a significant obstacle, with a move beyond $84,000 potentially opening the door to $84,800.
Oscillators Lack Conviction
Daily oscillator readings present a predominantly neutral picture. The relative strength index (RSI) stands at 52, while the Stochastic sits at 37. The commodity channel index reads negative 94, and momentum indicators including the MACD carry negative classifications. The Awesome oscillator registers 944, though momentum is at negative 1,832.
This oscillator data suggests that bitcoin's recovery has not yet generated convincing momentum confirmation despite improving price structure on shorter timeframes.
Support and Resistance Levels
Immediate support sits around $82,735, followed by the $82,500 region. A retreat beneath $82,500 could expose $81,500 and eventually the recent $80,308 low. On the upside, the volume-weighted moving average at $84,164 presents another immediate hurdle alongside the $83,900 to $84,200 resistance band.
Bitcoin remains above several longer-term moving averages, including the 50-period and 200-period averages, suggesting the underlying structure has not deteriorated significantly despite the daily chart displaying a sequence of lower highs.