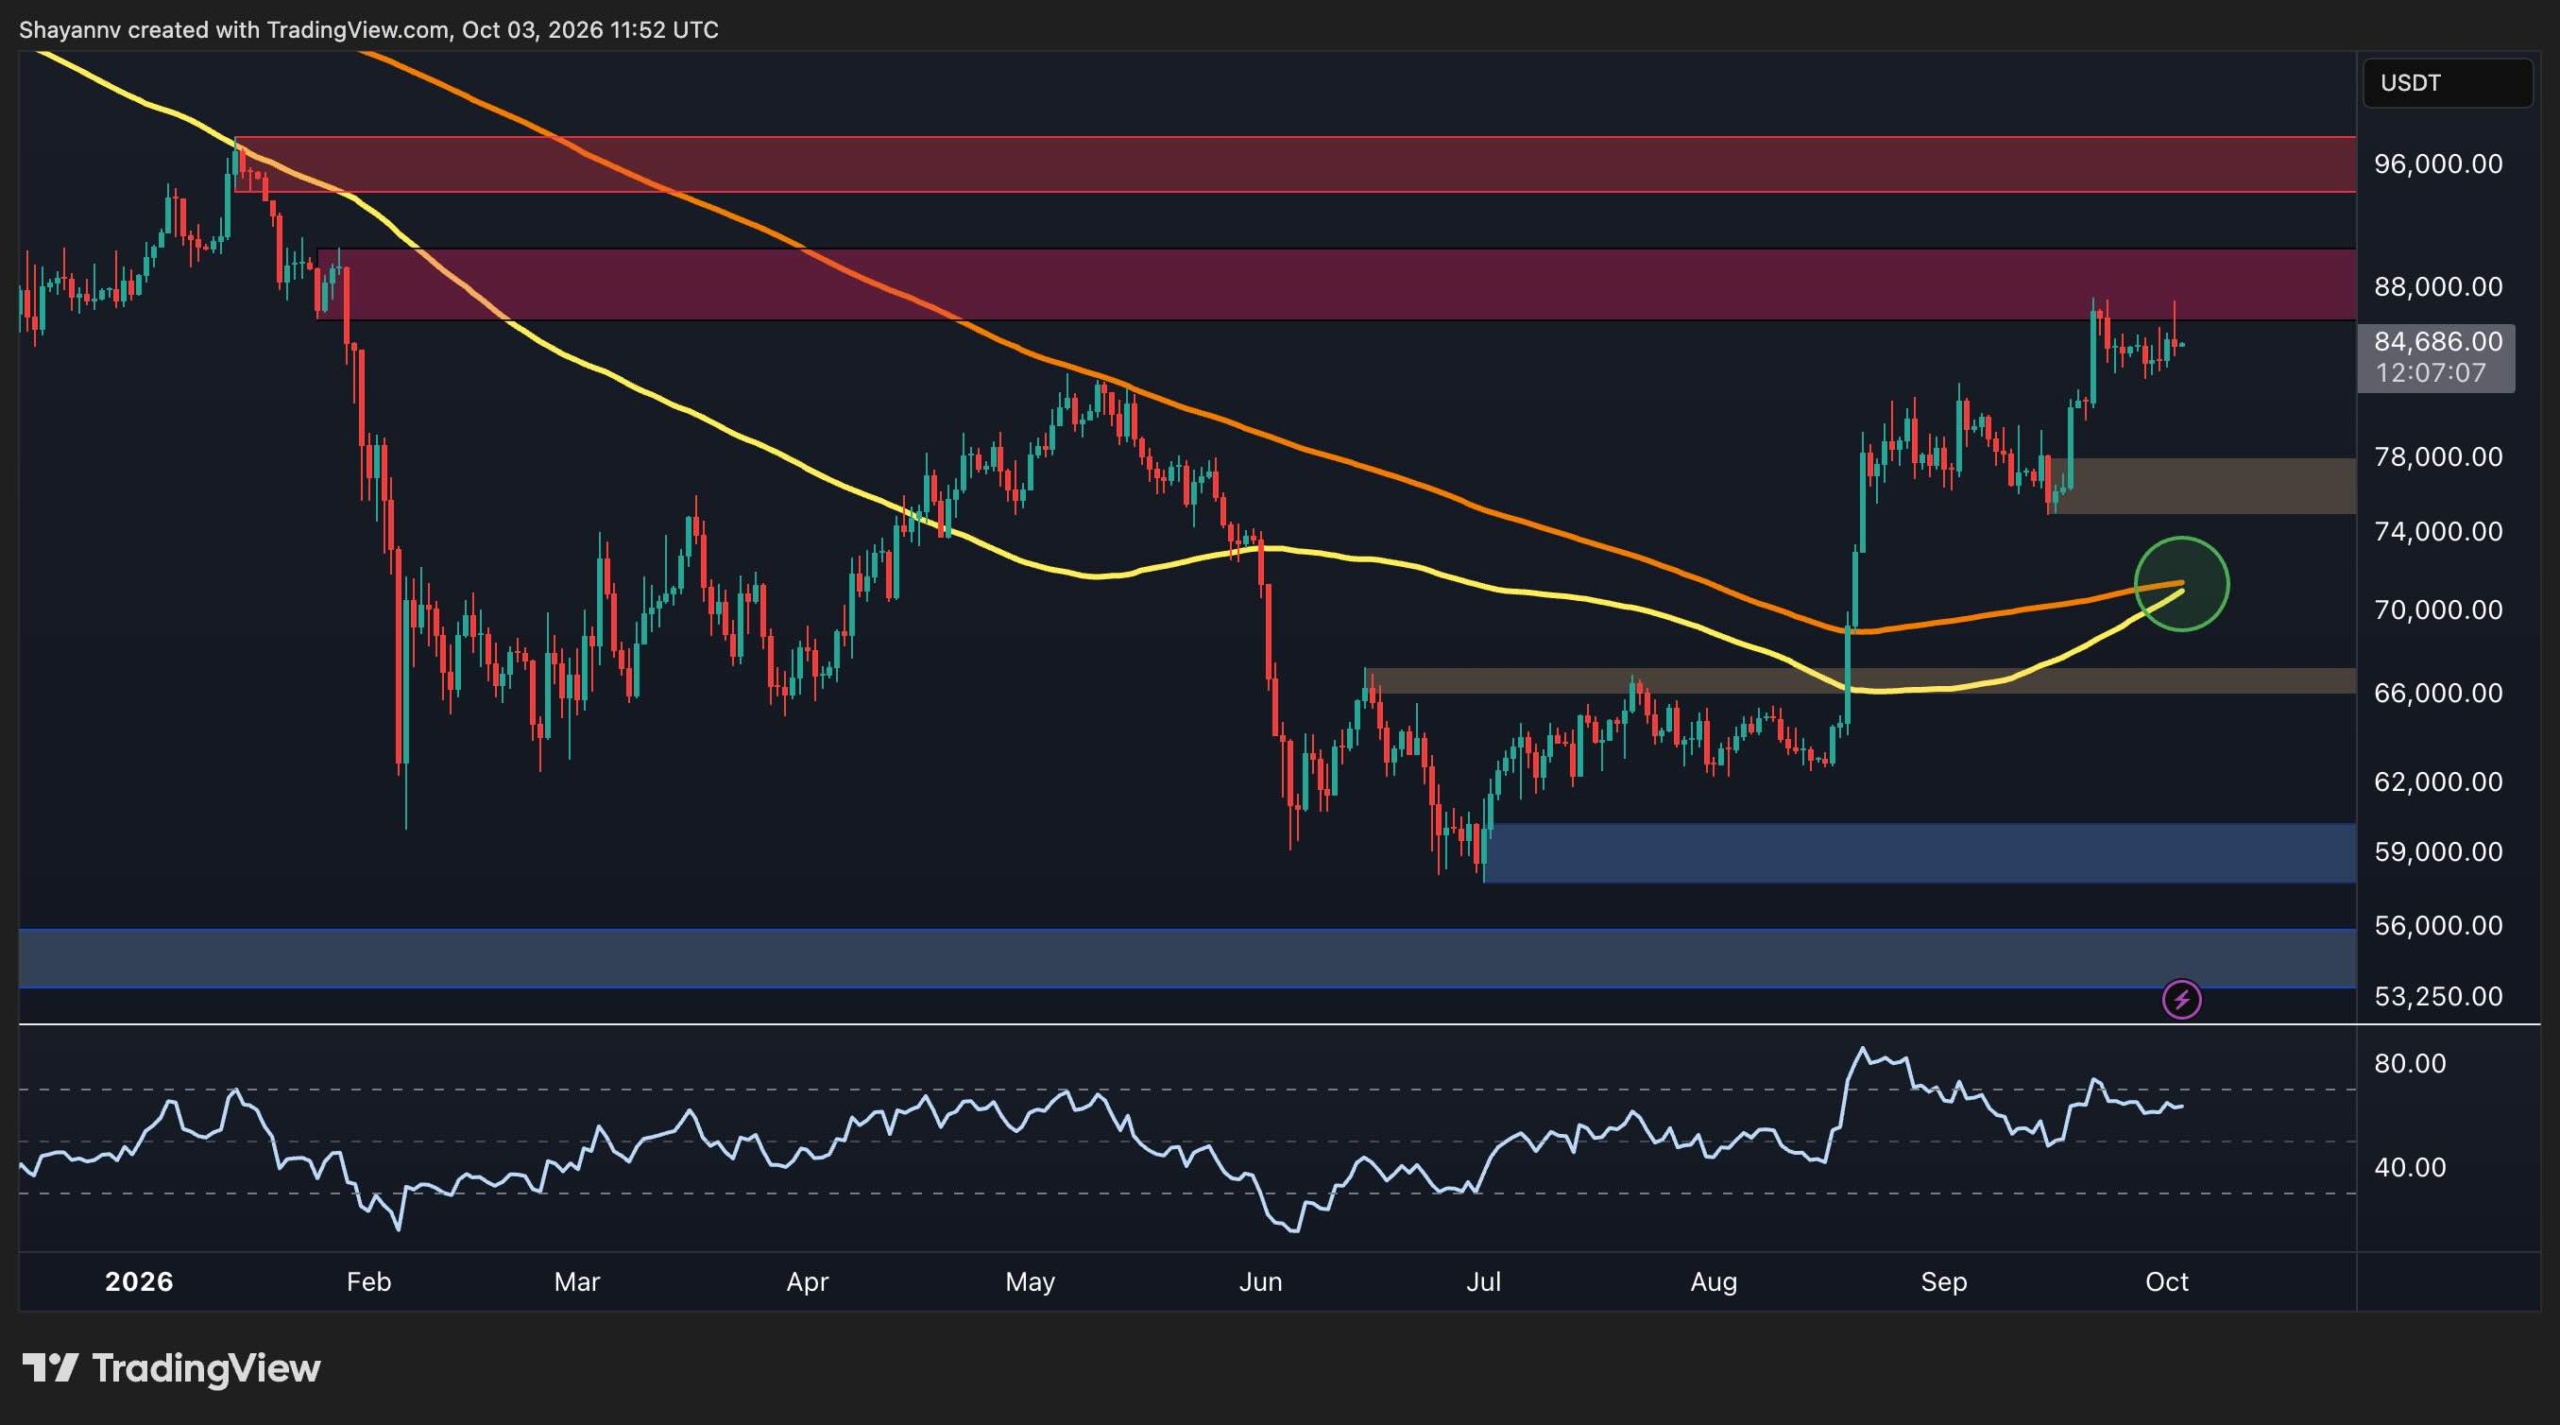
Bitcoin is trading around $84.7K following a strong recovery from the $60K area over the past couple of months. While market structure has improved, BTC is approaching a significant resistance cluster.
Daily Chart Structure and Key Levels
The daily chart indicates a structural improvement over the summer months. After establishing a base around the $60K area and consolidating, BTC broke higher from the $66K region. Moving through the $75K area shifted the market into a sequence of higher highs and higher lows.
BTC is currently trading near $84.7K, with an immediate resistance zone extending from roughly $86K to $88K. A daily breakout above $88K would strengthen the bullish structure, while the next major resistance area is located around $96K. On the downside, the first meaningful support sits between $74K and $78K, with another notable support region near $66K.
Moving averages are showing constructive developments, with the 100-day average turning upward and converging toward the 200-day average near $72K. As long as BTC stays above these averages, the broader recovery structure remains intact.
Short-Term 4-Hour Chart Dynamics
The 4-hour chart displays a short-term consolidation pattern following a surge from the $75K support area toward $86K. The structure forms a slightly descending range, with the upper boundary near $86K and the lower boundary around $82K.
- Upper Boundary: Near $86K, which recently capped price attempts and represents the key level for a potential upside breakout.
- Lower Boundary: Near $82K, serving as the first short-term level to monitor; a breakdown could expose the $74K-$78K support zone.
The Relative Strength Index (RSI) on the 4-hour chart has returned to the 50 area, reflecting balanced short-term momentum during the sideways price action.
Futures Taker Flow and On-Chain Signals
The 90-day Bitcoin Futures Taker CVD metric has shifted back into green, indicating buyer dominance after a period of neutral-to-bearish futures flow. This signals that aggressive buyers are lifting offers in the futures market as the price approaches the $86K resistance zone. Market observers note that sustained buying pressure coinciding with a breakout above resistance would confirm stronger demand, whereas repeated failures at resistance despite green CVD readings could signal absorption by sellers.