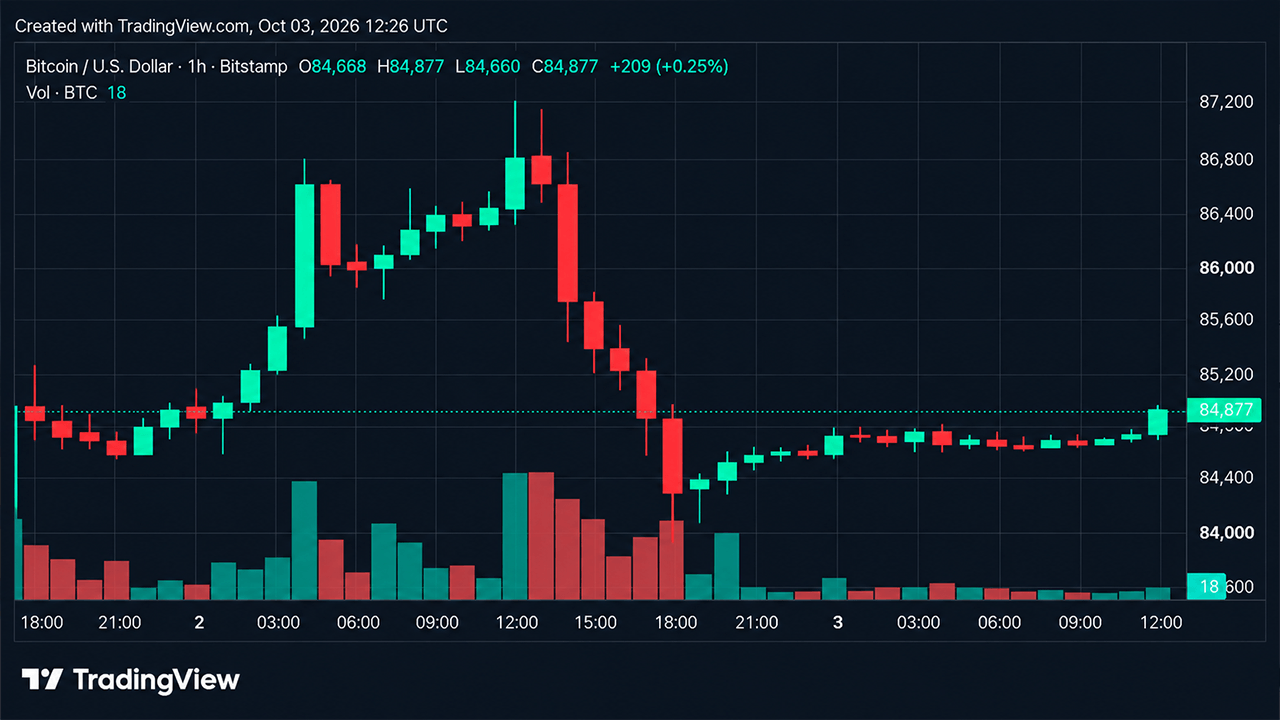
Bitcoin traded between $84,614 and $84,887 on Saturday, Oct. 3, 2026, following a sharp rejection from a 24-hour intraday high of $87,085. The market wedged between short-term consolidation and a broader bullish structure, with every tracked moving average remaining bullish while oscillators largely stayed neutral.
Hourly and 4-Hour Chart Dynamics
On the 1-hour chart, bitcoin settled into consolidation after falling from $87,219 to $83,841, building a narrow shelf around $84,400 to $84,700 on declining volume. This compression places $84,800 to $85,000 as the first upside trigger, whereas losing $84,300 would expose $83,841 followed by $83,500.
On the 4-hour chart, buyers stepped in around the low-$84,000s after the rejection from $87,219. Bulls need to reclaim the $85,000 to $85,500 region to reopen a path toward $86,000 and eventually $87,219, while support rests around $84,000 to $84,300 and $83,300 to $83,800.
Daily Trend and Technical Indicators
The daily chart remains in consolidation following a move from $74,913 to a high of $87,374. Buyers have repeatedly defended the $83,000 to $84,000 neighborhood, while sellers have controlled the upper-$85,000s through $87,000. A daily close above $85,500 to $86,000 would strengthen the case for another run at $87,374, while $82,555 serves as a crucial structural floor below.
The oscillator board is largely neutral, though momentum signals bullishness at 282.55 and the moving average convergence divergence (MACD) level at 1,932.11 signals a bearish reading reflecting the immediate retracement.
Moving Averages Support Structure
All recorded daily moving averages signal bullish conditions:
- 10-period EMA: $83,964.49
- 10-period SMA: $84,201.57
- 20-period EMA: $82,657.76
- 20-period SMA: $82,435.23
- 30-period EMA: $81,218.34
- 30-period SMA: $81,075.10
The immediate $83,964 to $84,200 band stands as the closest moving-average support zone, with the $82,435 to $82,658 area providing secondary structural support.