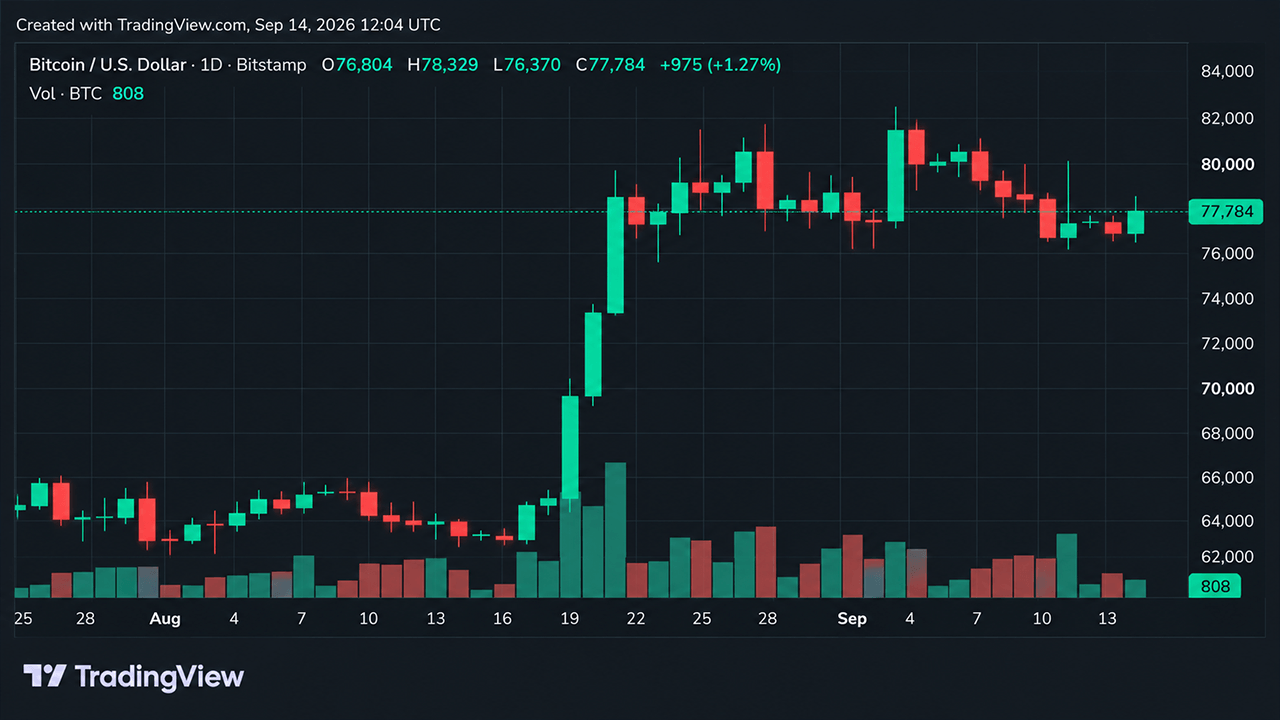
Bitcoin's price recovered to near $77,800 after buyers defended support around $76,370, turning an overnight decline into a rapid rebound. The bounce restored short-term momentum, but the market continues to face significant resistance overhead.
Recovery Shows Strength but Encounters Ceiling
Bitcoin rallied from its session low of $76,370 to $78,329 before settling around $77,800. The V-shaped recovery kept higher lows and higher highs intact on the 1-hour chart, maintaining a constructive short-term structure. However, the price remains well below the $78,300-$79,000 resistance zone that has repeatedly halted previous advances.
On the 4-hour timeframe, the recovery appears encouraging, but the larger resistance becomes apparent. Bitcoin has been grinding through the lower portion of its recent range after sliding from the low-$82,000s. Breaking through the $78,300-$79,000 barrier would be necessary to test the September 11 wick near $79,837.
Range-Bound Trading Continues
The daily chart reveals a different picture. Bitcoin previously advanced from $62,470 to $82,281 but has since spent weeks oscillating between roughly $76,000 and $82,000. The recent pullback created lower highs, suggesting consolidation rather than momentum toward new highs. The $80,000 level remains psychologically important for bulls seeking to challenge the previous high of $82,281-$82,833.
Support has proven resilient, with repeated attempts to push bitcoin materially below $76,000 failing to stick. The latest session again demonstrated this, with the price rebounding from the mid-$76,000s.
Technical Indicators Remain Indecisive
Oscillators are split on direction. Daily readings show nine neutral signals, one positive (Momentum), and one negative (MACD). The relative strength index sits at 57, while Stochastic and Stochastic RSI fast are at the lower end of their ranges.
Moving averages paint a more optimistic picture, with 11 positive readings against three negative ones. Bitcoin sits near the 10-day exponential moving average at $77,757, though the 10-day simple moving average at $78,157, 20-day SMA at $78,443, and volume-weighted moving average near $78,504 create overhead resistance.
Next Levels to Watch
For bulls, a clean break above $78,500 followed by $79,000 could reopen the path toward $80,000 and the previous highs near $82,281-$82,833. For bears, rejection around $78,300-$79,000 combined with a loss of $77,000 would place $76,370 back in play, while breaking decisively below $76,000 could expose the lower-$74,000s.