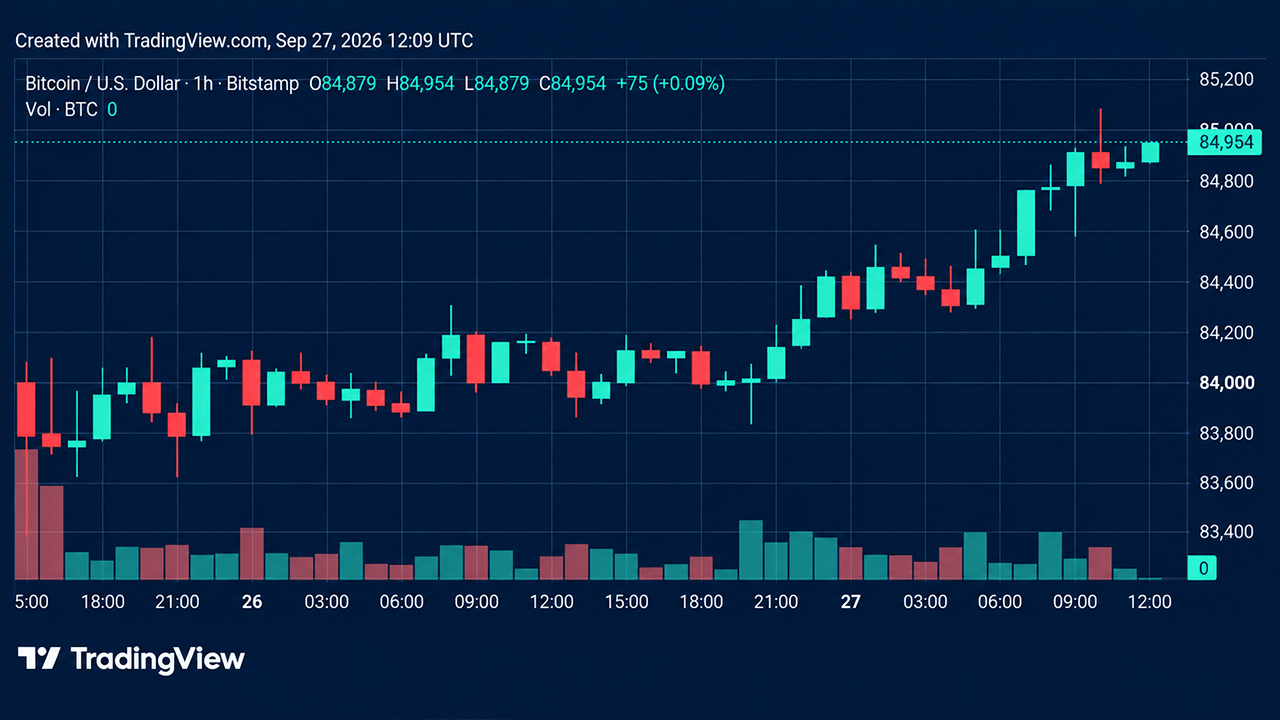
Bitcoin's price stood at $84,899 on Sunday morning at 8 a.m. Eastern time, up 0.9% over the previous 24 hours. Buyers were working their way back toward the $85,000 threshold following an earlier retreat from $87,374.
The daily technical picture remained firmly positive, with 14 moving averages flashing favorable readings. However, lighter trading volume suggested the latest recovery still faced hurdles before Bitcoin could attempt another push toward its September high.
Technical Resistance Points
Bitcoin's price needed to clear $85,000 and $85,945 to challenge the $87,374 level, while $83,300 remained a key support zone. The one-hour chart showed Bitcoin steadily recovering ground following a retreat into the low-$83,000s on September 23. After trading between approximately $83,300 and $85,300 for two days, BTC had worked its way toward $84,870.
A sustained move above $85,000 would bring $85,300 and eventually $87,374 back into focus. Rejection at the overhead barrier could keep Bitcoin confined to its recent trading range, while losing $84,000 followed by $83,300 would put the recovery in jeopardy.
Broader Price Context
The four-hour chart revealed that Bitcoin's price range had traveled significantly since a mid-September low of $74,913. Following a sharp advance to $87,374 between September 18 and 22, Bitcoin retreated into the $83,000-$84,000 neighborhood before gradually recovering toward $85,000.
On the daily chart, Bitcoin's price reflected a substantial recovery from its June low of $57,735. July and August established a base before September's advance carried prices to $87,374. The latest candles showed Bitcoin holding in the mid-$84,000s, comfortably above its summer trading range.
Indicator Analysis
The daily chart's oscillator readings showed nine neutral signals, two positive signals, and zero negative signals. The relative strength index registered 66, Stochastic stood at 77, and the commodity channel index read 91. Momentum and the moving average convergence divergence delivered bullish readings at 8,491 and 2,473, respectively.
Moving averages presented a stronger technical picture, with 14 positive readings, one neutral, and zero bearish signals. Bitcoin's price traded above every listed exponential and simple moving average, from the 10-period EMA at $83,328 to the 200-period SMA at $71,076.