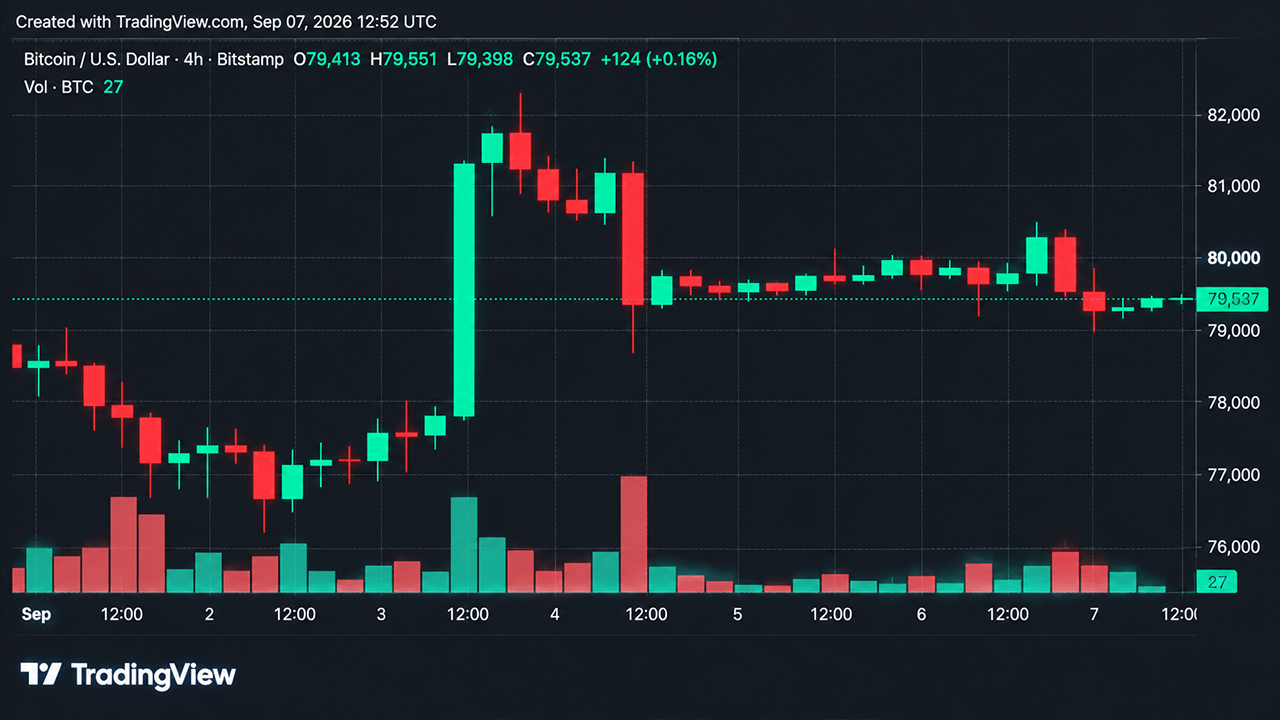
Bitcoin's price traded near $79,500 on September 7 after falling from a session high of $80,537, leaving short-term price action caught between fading momentum and a still-constructive daily trend. The market remains inside a $79,013-$80,537 intraday range, with these boundaries emerging as critical levels for determining the next directional move.
Hourly Charts Show Repair Bounce, Not Recovery
On the 1-hour chart, Bitcoin fell from roughly $80,200-$80,537 to $79,013 in one concentrated selling wave before grinding back toward $79,500-$79,520 on lower volume. Small-bodied hourly candles followed the low, with offers stacked from roughly $79,500 upward and bids thinning quickly below $79,000. The rebound represents a repair bounce within the larger 4-hour range rather than a confirmed recovery of the breakdown area.
Four-Hour Structure Shows Stalemate
On the 4-hour chart, Bitcoin's price failed at $80,500 and was followed by an impulsive decline to $79,013, producing the session's largest volume bars. Subsequent candles became smaller and two-sided between roughly $79,000 and $79,600, leaving the market in post-impulse balance rather than a fresh directional move.
A 4-hour close through $80,000-$80,537 would reopen the path toward the September 3 high, while a close below $79,013 would put the $76,300-$77,000 region back in play.
Daily Chart Tells More Constructive Story
The daily chart presents a more bullish backdrop. Bitcoin climbed to roughly $82,100-$82,200 on September 3 before giving back that advance on September 4 and holding roughly $79,500-$80,600 through September 5-6. Despite short-term weakness, Bitcoin remained above its key daily averages, meaning the higher-time-frame uptrend had not suffered a confirmed breakdown.
Resistance sits first around $80,494-$80,537 and then $82,108, while support extends from $79,013-$79,081 toward $76,298-$76,767.
Technical Indicators Send Mixed Signals
Bitcoin's daily oscillators are far more mixed, with one bearish signal, eight neutral, and two bullish readings. The moving average tape remains the stronger part of Bitcoin's technical setup, with 13 bullish readings, one neutral, and one bearish reading.
The moving averages providing bullish signals include the 10-day, 20-day, 30-day, 50-day, 100-day, and 200-day exponential and simple moving averages. The Awesome Oscillator and Momentum readings signaled bullish sentiment, while the Moving Average Convergence Divergence level signaled a bearish signal.
Key Levels to Watch
Bitcoin must defend $79,013, while $80,537 and $82,108 remain key upside levels. A sustained move back through $80,537 would put buyers back in control and bring $82,108 into focus. Alternatively, a break and hold below $79,013 would confirm that the rebound was only a temporary repair bounce and put the $76,300-$77,000 area back in play.