Can you make money by applying a straightforward RSI trading strategy to Bitcoin? In our continuous search for the most efficient and successful crypto trading strategies, we have a closer look at the Relative Strength Index (RSI).
In detail, we will present and discuss our extensive backtest results and shed light on the question of whether you would have made money by applying the RSI trading strategy to Bitcoin in 2023.
Here’s what you will find in this article:
- A quick introduction to the Relative Strength Index and our trading strategy.
- Key elements of our backtest
- A super-extensive deep dive into the backtest results
- And finally, an assessment of the results and the answer to whether utilizing the Bitcoin RSI trading strategy makes sense.
Ready? Let’s get it started!
What Is The Relative Strengths Index (RSI)
The Relative Strength Index (RSI) is a pivotal tool in the arsenal of many traders, particularly in the dynamic realm of cryptocurrency trading.
Developed by J. Welles Wilder in 1978, the RSI is a momentum oscillator that measures the speed and change of price movements. It operates on a scale of 0 to 100, making it an indicator that is both accessible and informative.
Central to the RSI’s utility is its ability to identify overbought and oversold conditions in the market (this will be important for our Bitcoin RSI trading strategy, too). An asset is typically considered overbought when the RSI reading is above 70, which could indicate that it might be primed for a price pullback or correction. Conversely, an asset is deemed oversold when the RSI dips below 30, suggesting a potential price bounce or upward correction.
Bitcoin and the RSI
In the context of Bitcoin, a highly volatile asset, the RSI takes on added significance. It allows traders to gauge the market’s momentum and potentially anticipate significant price movements. However, it’s crucial to note that while RSI can be a powerful indicator, it is not infallible.
In the fast-paced world of cryptocurrencies, RSI signals should ideally be used in conjunction with other analysis tools and market indicators to form a more comprehensive trading strategy. This multifaceted approach can help traders navigate the complexities of the market and make more informed decisions.
Want some backtest results? Bitcoin Backtest: How Effective Was the MACD Strategy in 2023?
How Our Backtest Worked — Details About the Bitcoin RSI Trading Strategy
Before looking at the backtest results, understanding how and what we backtested is essential. Therefore, this chapter will provide you with everything you need to know about how our Bitcoin RSI trading strategy works and present the core parameters.
Bitcoin RSI Trade Signals
As mentioned above, the RSI has two crucial levels, called overbought and oversold. These two levels can serve as entry points for trades. And that’s exactly how we structured our backtest:
- Bullish Signal: We opened a long trade whenever the RSI returned from an oversold level (< 0) into the neutral area (>30).
- Bearish Signal: Conversely, we opened a short trade when the RSI returned from overbought levels (>70) into the neutral area (<70)
Backtest Parameter
Here are the core parameters of our Bitcoin RSI backtest:
- Initial Capital: $1,000
- Take Profit: 3%
- Stop Loss: 1%
- Leverage: 2x
- Chart Timeframe: 1H and 1DB
Bitcoin RSI Trading Strategy — Backtest Results
It’s time to leave the theoretical playground and dive into the results. As you’ve seen above, we performed the backtest based on the daily and hourly timeframe. Accordingly, the results are clustered according to the timeframes. Moreover, we will cluster the results according to long and short trades. Let’s get into it!
Backtest Results: Daily Chart
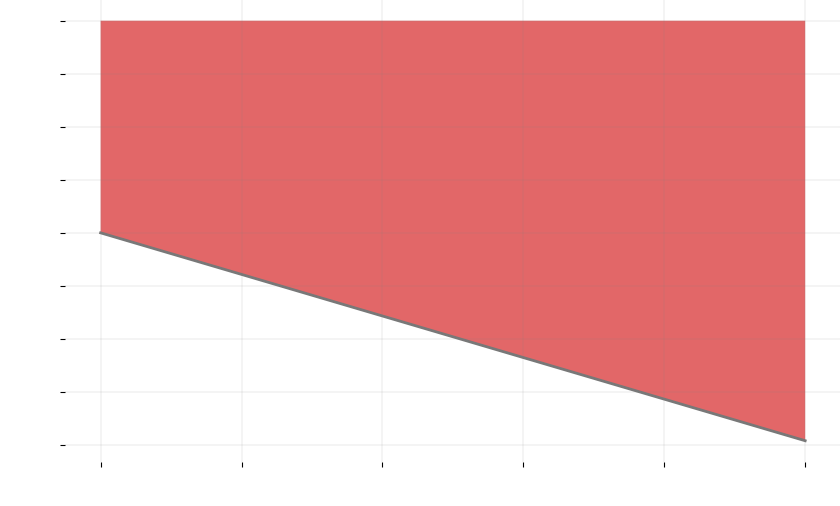
Long Signals
Trading the Bitcoin RSI strategy on the daily chart would have resulted in only two trades in 2023. However, more importantly, none of them would have been closed successfully based on our trading parameters. Accordingly, you would have ended in a loss of 4% at the end of the year.
- Overall Number of Trades: 2
- Win Trades: 0
- Win Rate: 0%
- Max. Drawdown: $40
- Final Win/Loss: -4%
- Final Amount: $960
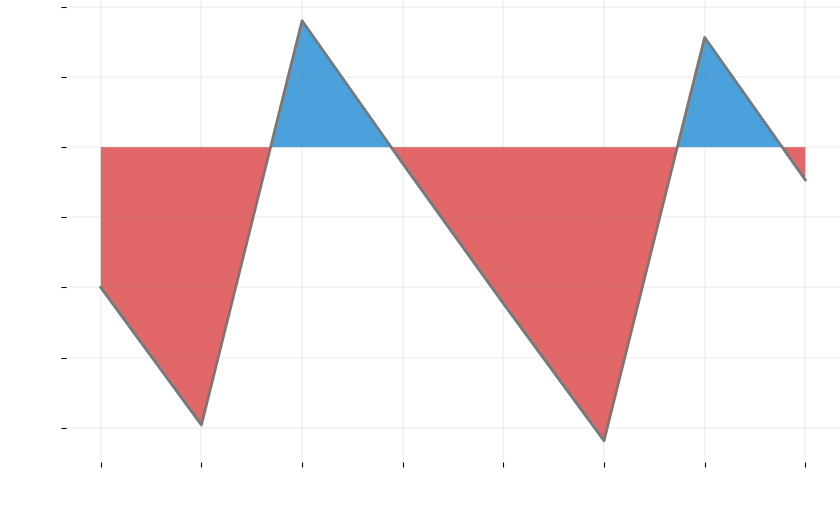
Short Signals
Although the amount of short signals is considerably higher compared to the long signals, the results are equally worse. Based on a win rate of on 25%, you would have closed the year with a meager loss of $5.
- Overall Number of Trades: 8
- Win Trades: 2
- Win Rate: 25%
- Max. Drawdown: $41
- Final Win/Loss: -0.5%
- Final Amount: $995
Backtest Results: Hourly Chart
Long Signals
The results on the hourly chart are only slightly better than on the daily chart. Out of 56 trades, you would have been able to close 16 successfully. This would have resulted in a win rate of 29%. However, ultimately, you would have been able to close the year with profit of 13%.
- Overall Number of Trades: 56
- Win Trades: 16
- Win Rate: 29%
- Max. Drawdown: $2.4
- Final Win/Loss: 13.2%
- Final Amount: $1,132
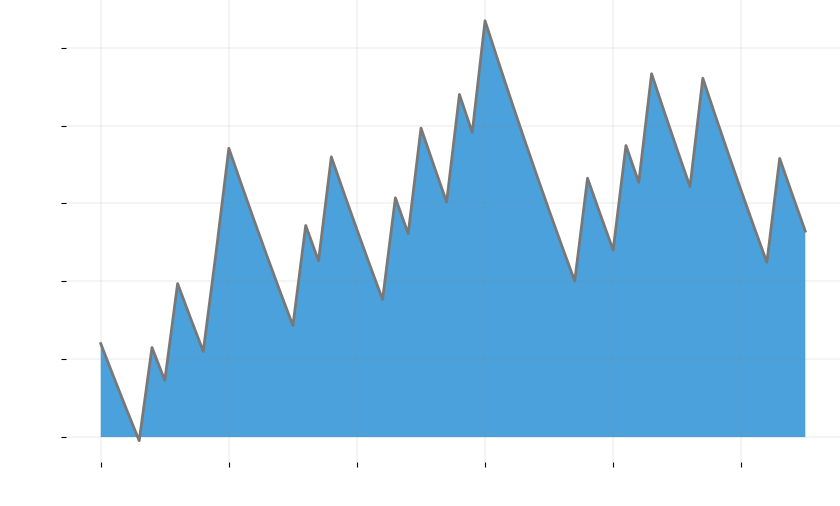
Short Signals
Trading the short signals of our Bitcoin RSI strategy would have been the most successful compared to the other signals, resulting in a whopping profit of almost 66%. However, it is worth mentioning that the win rate is still sub-optimal, with only 34%.
- Overall Number of Trades: 76
- Win Trades: 26
- Win Rate: 34%
- Max. Drawdown: $149
- Final Win/Loss: 65.7%
- Final Amount: $1,656
Bitcoin RSI Strategy — Is It Worth Trading?
After reviewing the detailed backtest results, the answer to the above question is relatively simple: No! However, here’s a more detailed assessment of the results:
- Devastating Win-Rate: Neither the daily nor hourly trades resulted in an acceptable win rate. Usually, we consider a trading strategy as worth trading when the win rate is above 70%. Therefore, the achieved win rates are far below the desired results. Accordingly, one cannot recommend the Bitcoin RSI strategy (at least not with the described setup).
- Buy & Hold Outperforms RSI Strategy: One of the most important benchmarks for every trading strategy is the comparison with simply buying and holding an asset. In this context, the Bitcoin RSI strategy performed worse. Even the most successful signal resulted in only 65% profit at the end of the year. At the same time, you could have achieved a whopping ~125% (or even 250% with a 2x leverage) by simply buying Bitcoin in January and selling Bitcoin in September.
About CryptoKnowledge & the CryptoKnowledge App
At CryptoKnowledge, we pride ourselves on providing top-notch crypto data and tools. Our app is accessible on both the App Store and Play Store, featuring almost 200 crypto tokens and an array of functionalities like crypto signals, screeners, AI-based forecasts, and much more. Discover how we can elevate your trading experience, and download the app now!
This article was initially published on CryptoKnowledge
![]()
Bitcoin RSI Trading Examined: A 2023 Backtest Breakdown was originally published in The Dark Side on Medium, where people are continuing the conversation by highlighting and responding to this story.