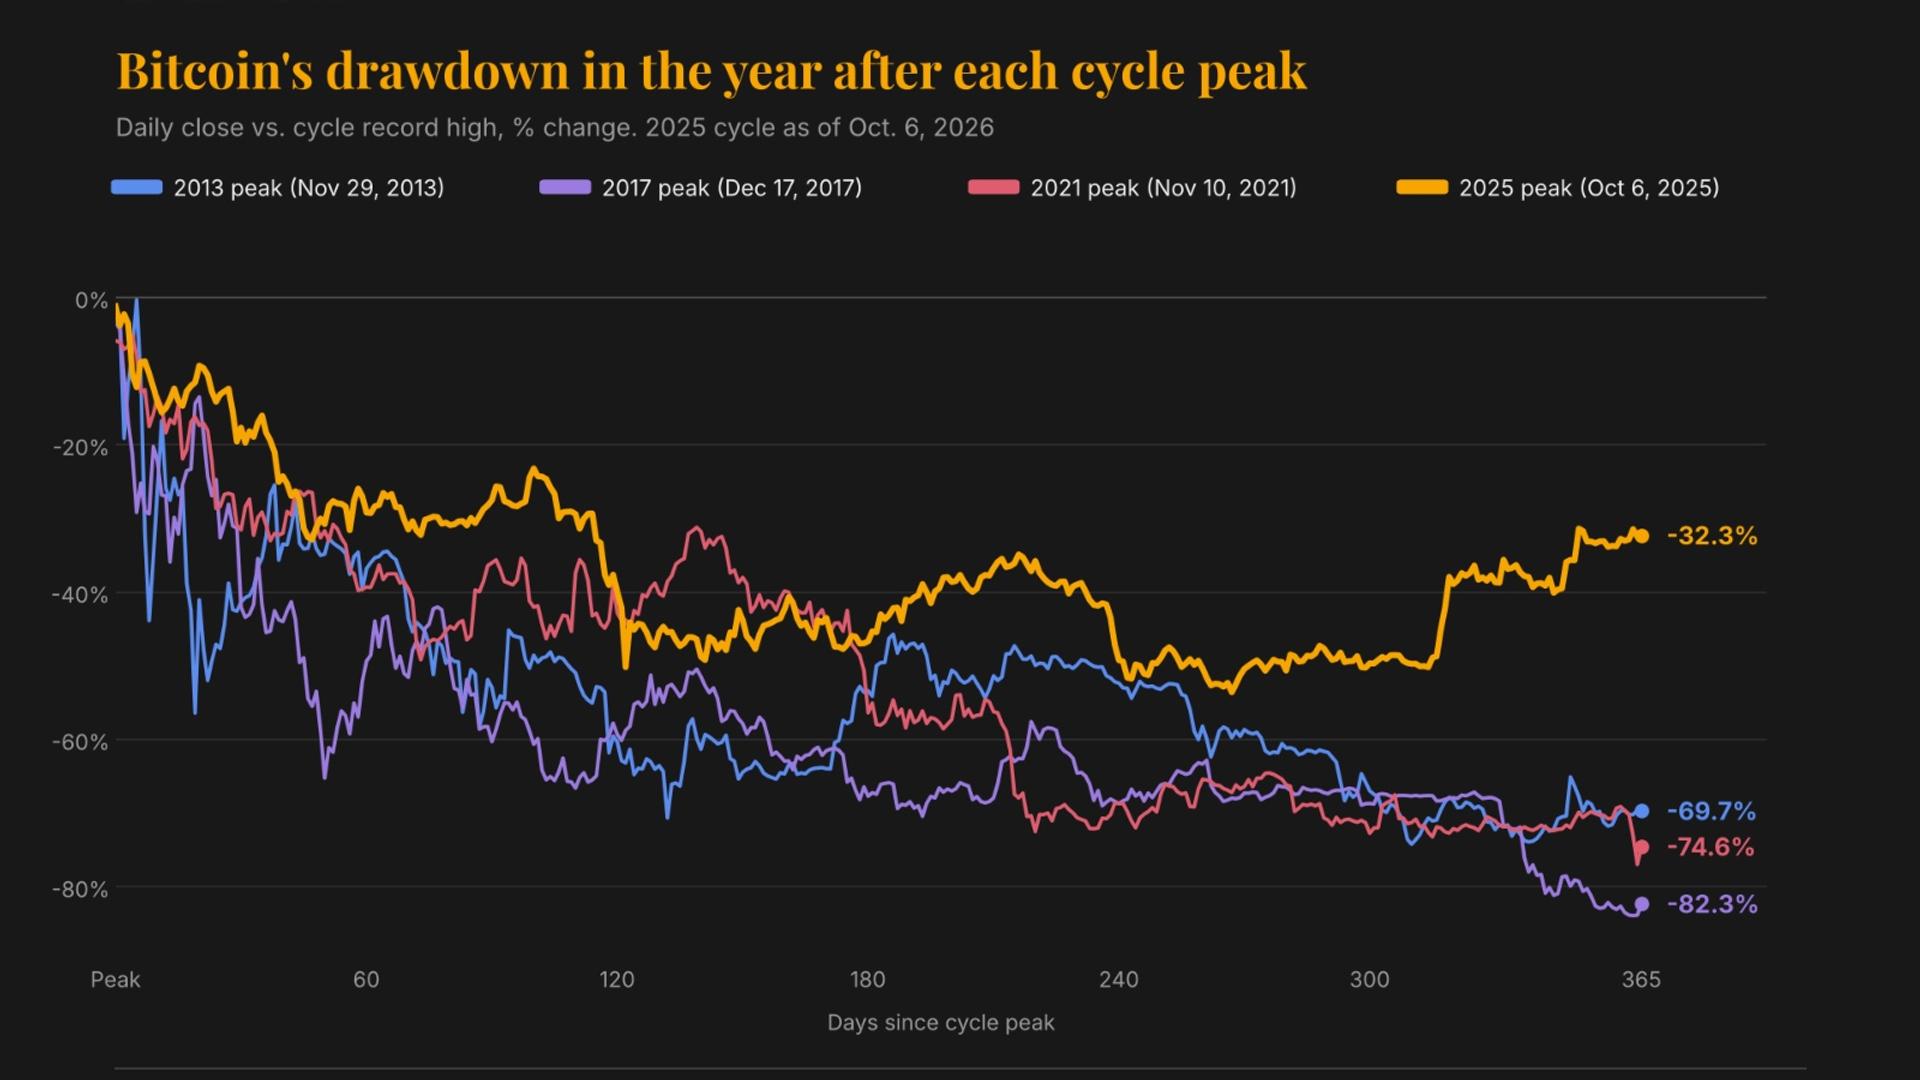
Bitcoin is down 32% a year after its record high of $126,000 on October 6, 2025, trading at $85,453. While a decline of that magnitude would constitute a significant loss in traditional markets, it represents a considerably gentler correction compared to bitcoin's historical bear markets.
One year after the 2013 peak, bitcoin had declined 69.7%. Following the December 2017 record high, it fell 82.3%, and after the November 2021 peak, it dropped 74.6%. The current downturn's shallow trajectory extends beyond the one-year mark. At its lowest point just below $59,000 on June 30, bitcoin was down more than 53% from its peak, whereas previous bear markets saw prices plummet 77% to 85% from record highs.
Institutional Money Reshapes Market Dynamics
The primary driver behind the milder downturn is a shift in market participants. Previous bull runs were fueled largely by retail traders using leverage, often ending in crashes marked by fund blowups and exchange failures. The 2023–25 uptrend, by contrast, was driven by institutional inflows through regulated investment vehicles such as ETFs, with the subsequent downturn reflecting a reversal of those flows.
Institutional money behaves differently than retail speculative flows. ETF allocation money rebalances to target weights and buys weakness by construction. Most leverage was unwound on October 10 of the previous year, when a macro-driven sell-off triggered more than $19 billion in liquidations across crypto derivatives markets.
The bear market experienced both a shallower decline and an earlier trough than previous cycles. In prior downturns, the lowest point often arrived around the one-year mark or later, but this cycle reached its bottom after approximately nine months, followed by a swift recovery.
The Volatility Trade-Off
The calmer correction comes with a cost: calmer rallies. Bitcoin's volatility has steadily declined since U.S. spot ETFs debuted in early 2024. Bitcoin's current annualized volatility hovers around 40%, noticeably lower than its long-term historical levels exceeding 80%.
Some analysts characterize the future pattern as a staircase trajectory—grinding up, experiencing an air pocket, then repairing quickly—rather than a parabolic move. However, sharp bullish moves remain possible given bitcoin's capped supply of 21 million, high ownership concentration among long-term holders, and the potential for large ETF inflows, rapid improvements in macro liquidity, or concentrated short covering.
Risks Ahead
The derivatives market currently shows neutral to bearish positioning. Implied volatility remains near its lowest percentile on record, and one-year options skew has not yet shifted to reflect strong upside expectations.
Broader macroeconomic conditions may determine the market's direction. The 30-year U.S. Treasury yield recently hit 5.7%, a level last seen in April 2002, having risen more than 80 basis points this year. This rising yield increases the opportunity cost of holding non-yielding assets like bitcoin. Some analysts believe this hardening of yields stems from fiscal concerns, while others connect it to the growth outlook.