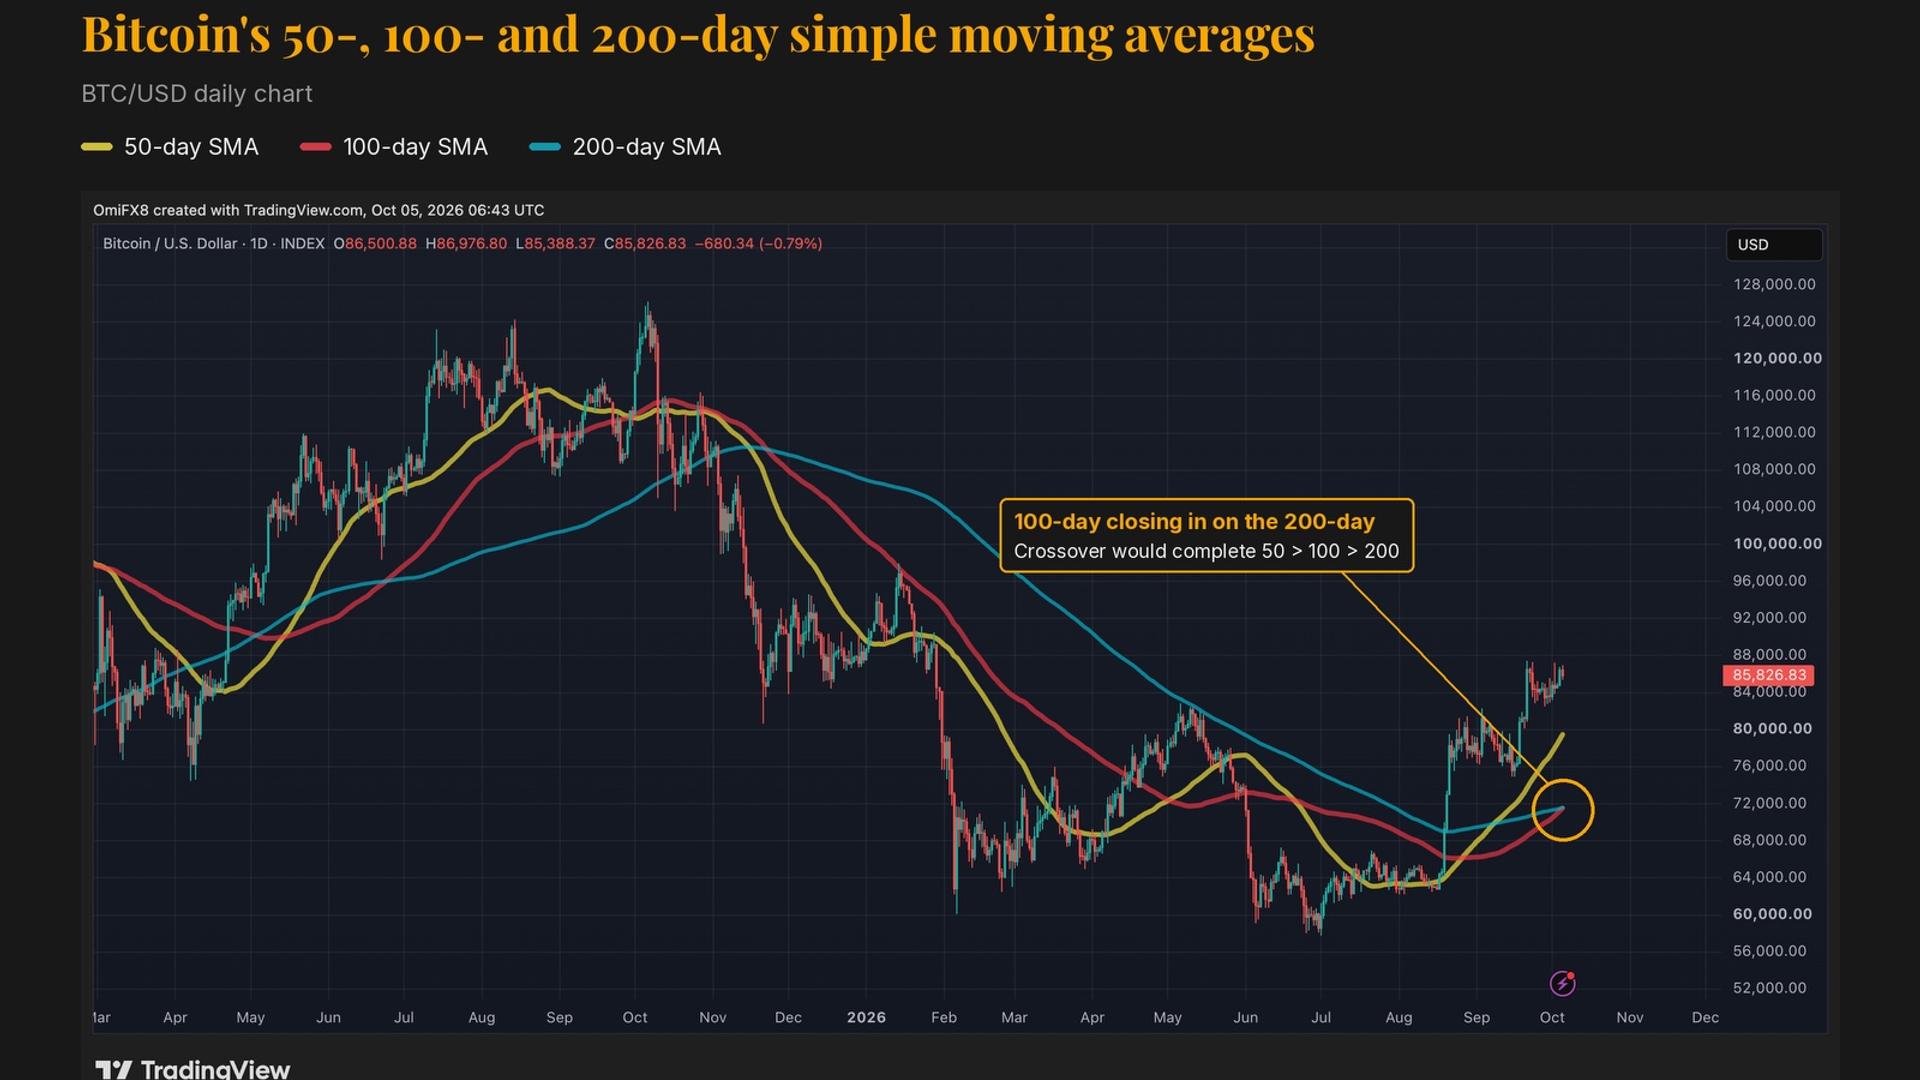
Bitcoin's key price moving averages are approaching a significant technical milestone. The cryptocurrency's 50-, 100-, and 200-day moving averages are nearly aligned in a bullish configuration for the first time since June 2025, according to analysis from Giottus exchange CEO Vikram Subburaj.
The alignment occurs when the 50-day average sits above the 100-day, which in turn sits above the 200-day. As of early October 2026, the 50-day average stood at $79,495, well above the other two. The 100-day average, at $79,493, was rising and approaching the 200-day average at $79,539.
Traders use moving averages to identify trend direction. When shorter-term averages sit above longer-term ones, it signals that recent prices are stronger than older ones, indicating upward momentum. "That crossover would restore the order of 50-day above 100-day above 200-day for the first time since the previous alignment formed on June 24, 2025," Subburaj told CoinDesk.
Bitcoin has gained more than 40% during the third quarter, rising to $87,000, though recent advances have stalled near $85,000 amid strength in the U.S. Dollar Index.
Historical Precedent Mixed
Past bullish moving average alignments have produced varying results. An alignment that formed on October 27, 2020, when bitcoin traded around $13,600, remained intact until May 2021, during which time bitcoin reached a then-record high above $64,000. A similar setup confirmed in early November 2023 lasted until May 2024, with bitcoin more than doubling from roughly $35,000 to $73,000.
Other alignments have proven short-lived and less rewarding. The bullish alignment from June 2025 lasted 97 days but resulted in only modest gains, with bitcoin rising from about $106,000 to $112,000. A setup in June 2024 lasted just 20 days before bitcoin fell approximately 10%.
The Critical Test Ahead
"The crossover strengthens the trend case, but it does not guarantee its continuation," Subburaj said. "The asset's price behaviour afterwards will determine whether it becomes a sustained bull-market structure or another short-lived alignment."
The key measure going forward will be whether bitcoin can sustain its position above the 50-day moving average. "The more consequential test is whether Bitcoin can hold the 50-day average during a correction," Subburaj explained.