Bitcoin's price swings continue to exceed major traditional assets, though recent volatility moderation has brought the cryptocurrency closer to levels seen in large technology stocks.
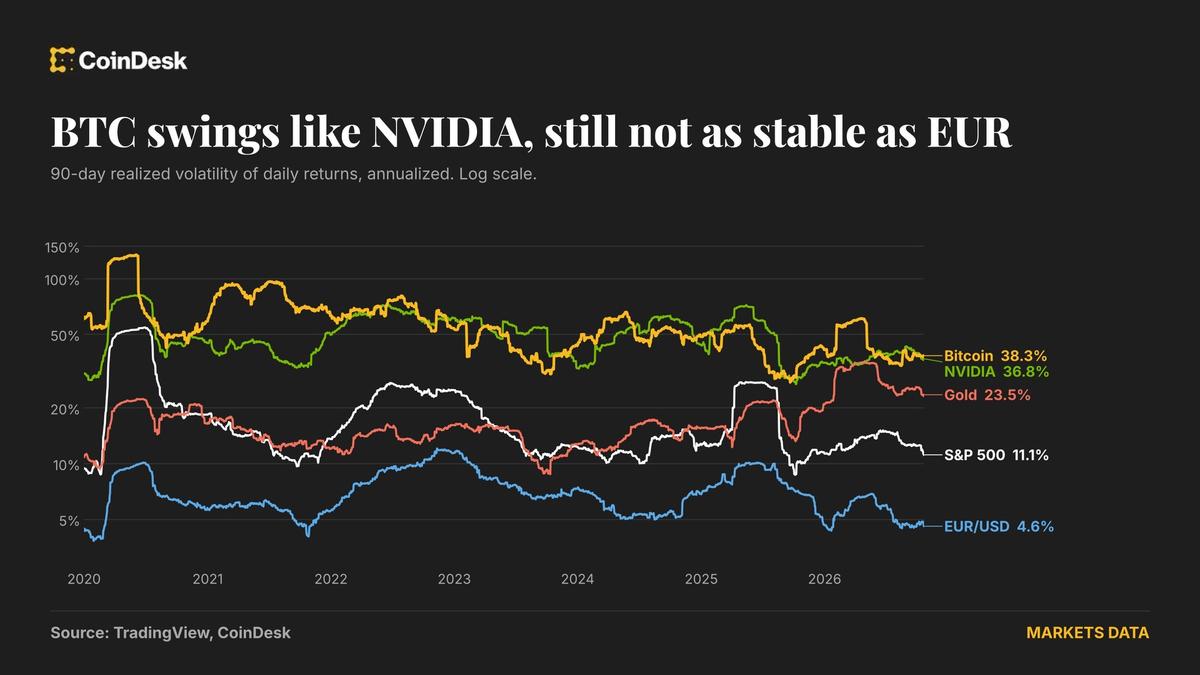
According to 90-day realized volatility measurements, bitcoin trades at approximately 38% volatility as of Thursday. This compares to gold at 23.5%, the S&P 500 at 11%, and the euro-dollar exchange rate at 4.6%. Bitcoin's volatility is roughly three times higher than stocks and about eight times that of the EUR/USD pair, the most liquid fiat currency pair.
The largest individual stock comparison shows bitcoin approaching parity with Nvidia, which trades at about 37% volatility. This convergence reflects the growing popularity of risk management strategies in bitcoin markets, which have steadily reduced the largest cryptocurrency's price swings and increased appeal to professional investors.
Historical Volatility Trends
Bitcoin's volatility has improved considerably over time. The cryptocurrency's 90-day volatility averaged approximately 58% since January 2020, with a peak of 134% in June 2020. Its calmest reading of 27.5% occurred in September 2025 when prices rose above $100,000.
Options Market Signals
Current options-based expectations show diverging signals between cryptocurrency and equities markets. Volmex's 30-day bitcoin implied volatility index, known as BVIV, remains below its 200-day moving average, suggesting expectations for relative stability in crypto. Meanwhile, the VIX index for the S&P 500 has topped its 200-day moving average, indicating traders are pricing increased uncertainty in equity markets.