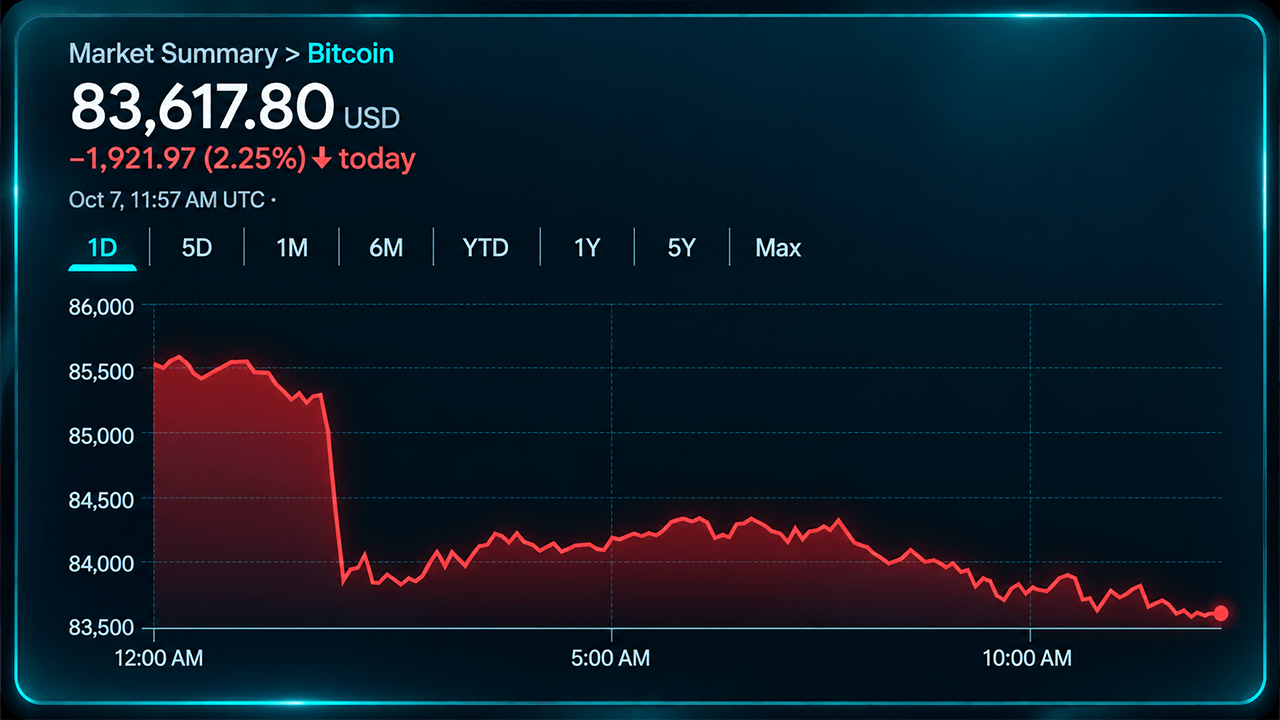
Bitcoin's price fell to $83,404 on Wednesday after a high-volume overnight selloff broke through short-term support levels. The BTC/USD pair traded near the floor of its 24-hour range as sellers maintained control across multiple timeframes.
Short-Term Weakness Dominates
The 1-hour chart showed the most severe pressure, with a candle that opened at $85,525 and plunged to $83,562 on notably heavy volume of 309 BTC—far exceeding the typical 12-90 BTC seen in surrounding hours. The relative strength index (RSI) on the 1-hour chart dropped to 27, indicating stretched selling conditions, while price remained below all listed moving averages.
The 4-hour chart reinforced the bearish setup, recording its heaviest volume during the midnight-to-4 a.m. UTC candle, which opened at $85,544 and closed at $84,121 before extending lower to the session floor of $83,404.
Daily Structure Remains Intact
Despite the intensity of the selloff, Bitcoin's daily chart showed signs of resilience. The price fell below the 10-period exponential moving average (EMA) at $84,620 and the 20-period simple moving average (SMA) at $84,200, but remained above the 20-period EMA at $83,520, the 30-period SMA at $81,827, and the 50-period SMA at $80,286.
Daily oscillators painted a mixed picture, with the RSI at 54, Stochastic at 52, and the commodity channel index (CCI) at 6 all registering neutral readings. The moving average convergence divergence (MACD) showed a bearish reading of 1,717.
Key Levels Ahead
Bulls face a critical test at $83,404. A sustained hold at this level could invite a relief bounce, though reclaiming $84,000 to $84,350 would signal stronger evidence of buyer conviction. On the downside, a break below $83,404 would target the $81,950 daily pivot as the next major support zone.